Measuring Heat Islands
Urban heat islands may be identified by measuring surface or air temperatures. Surface temperatures have an indirect but significant influence on air temperatures. For example, parks and vegetated areas, which typically have cooler surface temperatures, contribute to cooler air temperatures. Dense built-up areas, on the other hand, typically lead to warmer air temperatures. Because air mixes within the atmosphere, though, the relationship between surface and air temperatures is not constant.
On this page:
- Surface Measurements
- Air Temperature Measurements
- Removing the Urban Heat Island Effect from the Global Temperature Record
Surface Measurements
The satellite image at left is an example of a surface-based measurement that records energy reflected and emitted from the land, including roofs, pavements, vegetation, bare ground, and water.
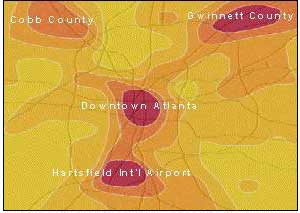
All surfaces give off thermal energy that is emitted in wavelengths. Instruments on satellites and other forms of remote sensing can identify and measure these wavelengths, providing an indication of temperature.
By using radiometers mounted on aircraft or a satellite, researchers can easily collect many surface observations. The National Aeronautics and Space Administration (NASA) has conducted flyovers using an aircraft-mounted sensor in many cities, including Baton Rouge, Sacramento, and Salt Lake City.
Several cities also use Landsat satellite data to classify land cover and identify heat islands. The Landsat 7 satellite, a U.S. satellite used to acquire remotely sensed images of the Earth's land surface and surrounding coastal regions, provides information from which researchers can derive surface temperatures and evaluate heat islands.1
Surface measurements taken by remote sensing have several limitations. First, they do not fully capture radiant emissions from vertical surfaces, such as a building's wall, because the equipment mostly observes emissions from horizontal surfaces such as streets, rooftops, and treetops. Second, remotely sensed data represent radiation that has traveled through the atmosphere twice, as wavelengths travel from the sun to the earth as well as from the earth to the atmosphere. Thus, the data must be corrected to accurately estimate surface properties including solar reflectance and temperature.
Air Temperature Measurements
Air temperatures are usually measured at about 5 feet (1.5 meters) above the ground, where standard weather observations are taken. A variety of sources can be used to take these measurements, including National Weather Service stations; military weather stations; urban or regional weather station networks (such as the Baltimore Ecosystem Study![]() ); and field campaigns and transect studies, which involve using hand-held measurement devices or mounting measurement equipment on cars or aircraft. The isotherm map at right illustrates a city's typical air temperature profile at night.
); and field campaigns and transect studies, which involve using hand-held measurement devices or mounting measurement equipment on cars or aircraft. The isotherm map at right illustrates a city's typical air temperature profile at night.
Like surface measurements, air temperature measurements have limitations. The correlation between surface and air temperature decreases as altitude increases. Thus, the ability of air temperatures to provide a reliable indicator of the thermal properties of various surfaces depends on the height of the measurement. Using air temperature measurements to evaluate a heat island is also complicated by several factors:
- data are needed from weather stations both within a city and in non-urban areas close to the city;
- researchers must consider changes in instrumentation, sampling, data recording methods, and station microclimate;
- comparisons between urban and non-urban temperature records become less valid as areas around airports become urbanized, because airports often are used as the source of "non-urban" data.
Removing the Urban Heat Island Effect from the Global Temperature Record
Heat islands may skew long-term temperature records as urbanization encroaches on weather stations located near the outskirts of town. Consequently, researchers must remove heat island effects from temperature records to accurately estimate climate change.
The data may be corrected in a variety of ways. In some cases, researchers statistically adjust urban weather station data to match trends seen in nearby rural stations; in other analyses urban data are simply excluded from the record.
The Intergovernmental Panel on Climate Change (IPCC) has concluded that the impact of urban heat islands on temperature records is "real but local," and has only a negligible effect on regional or global trends.2 The IPCC also noted that urban heat island effects on local climate appear to include changes in precipitation, clouds, and daily temperature range.
Some of the methods used to remove urban biases from the temperature record are discussed in the National Climatic Data Center's background article on National Temperature Trends: The Science Behind the Calculations.
Footnotes and References
1. The Landsat 7 satellite was launched in 1999. Landsat 8 was launched in 2013 with improved sensors and technology.
2. Trenberth, K.E., P.D. Jones, P. Ambenje, R. Bojariu, D. Easterling, A. Klein Tank, D. Parker, F. Rahimzadeh, J.A. Renwick, M. Rusticucci, B. Soden and P. Zhai. 2007. Observations: Surface and Atmospheric Climate Change (PDF) (102 pp, 24MB)![]() . In: Climate Change 2007: The Physical Science Basis. Contribution of Working Group I to the Fourth Assessment Report of the Intergovernmental Panel on Climate Change [Solomon, S., D. Qin, M. Manning, Z. Chen, M. Marquis, K.B. Averyt, M. Tignor and H.L. Miller (eds.)]. Cambridge University Press.
. In: Climate Change 2007: The Physical Science Basis. Contribution of Working Group I to the Fourth Assessment Report of the Intergovernmental Panel on Climate Change [Solomon, S., D. Qin, M. Manning, Z. Chen, M. Marquis, K.B. Averyt, M. Tignor and H.L. Miller (eds.)]. Cambridge University Press.