Rest of River of the GE-Pittsfield/Housatonic River Site
Overview of the Rest of River
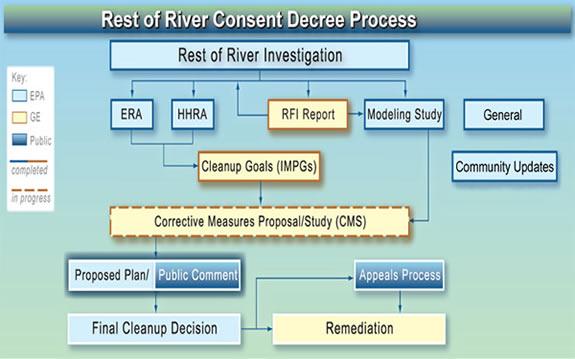
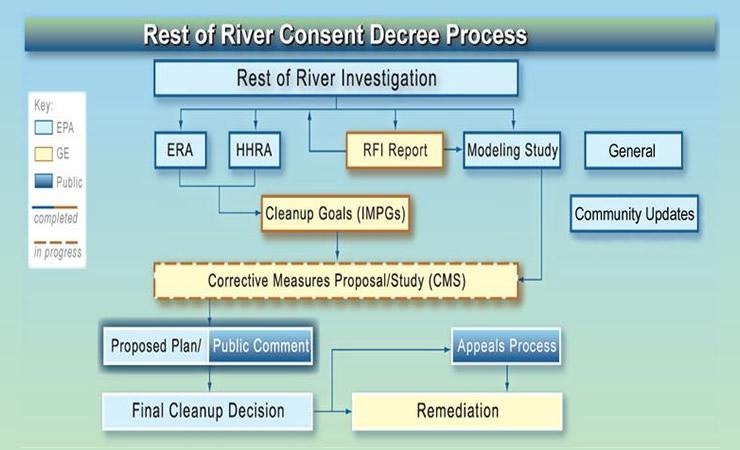
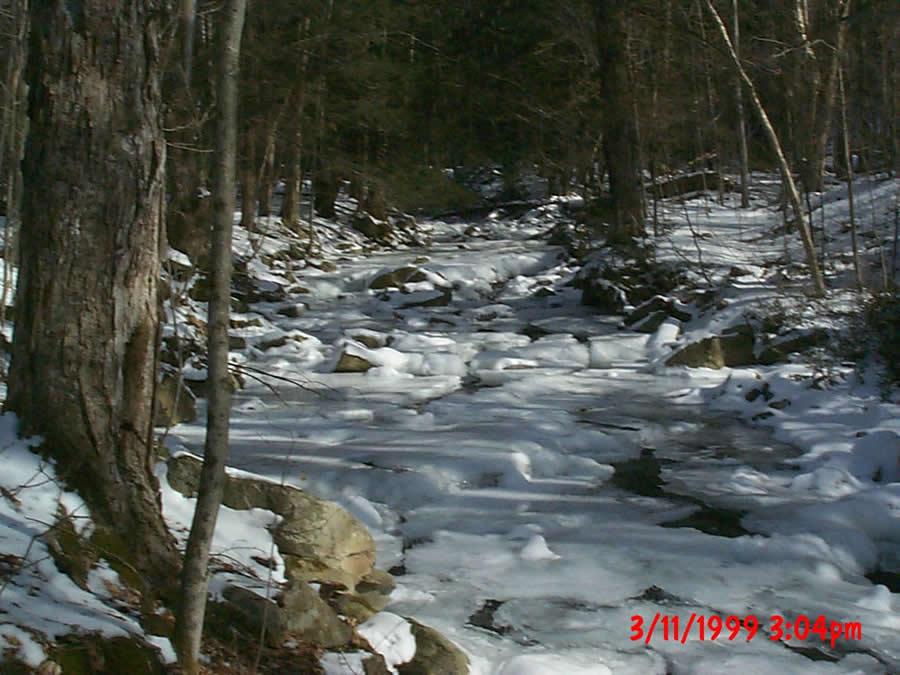
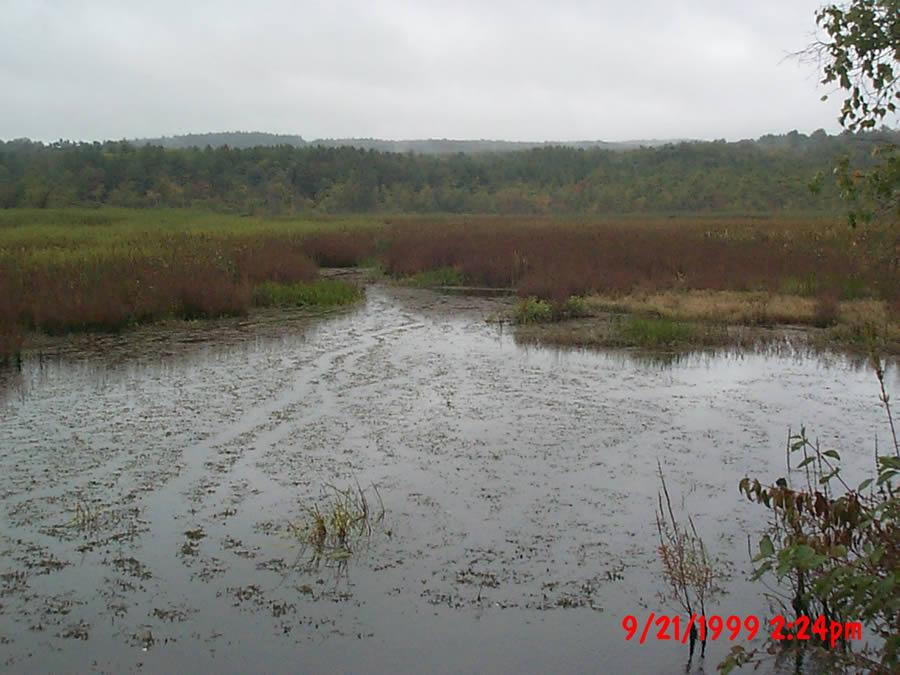
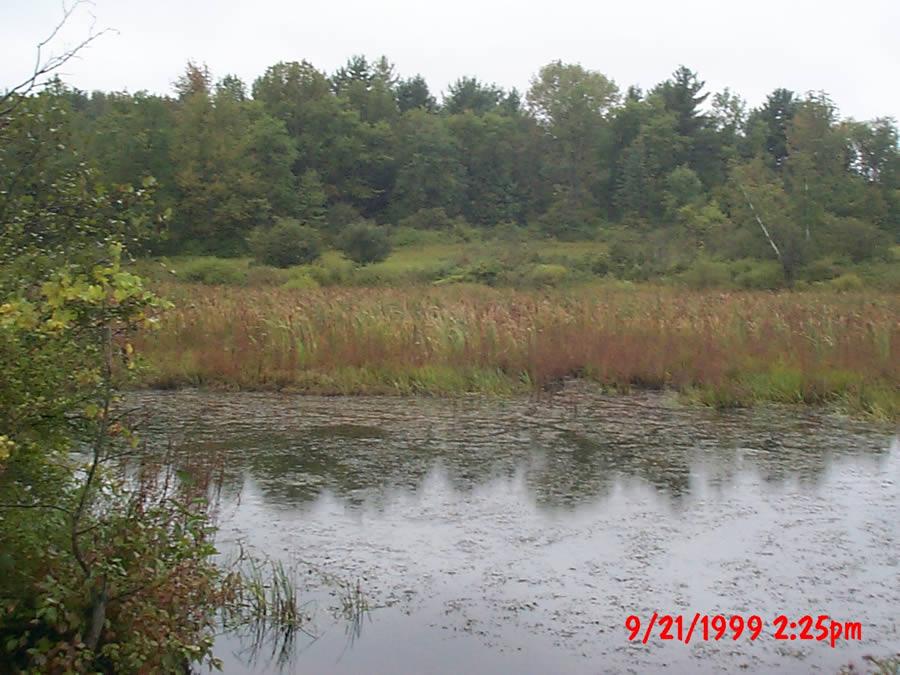
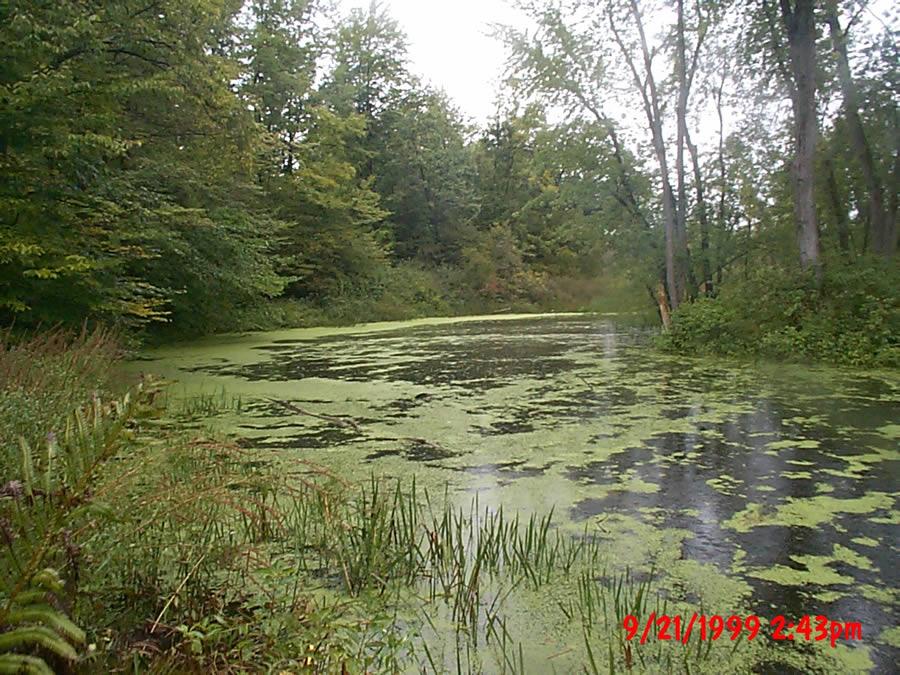
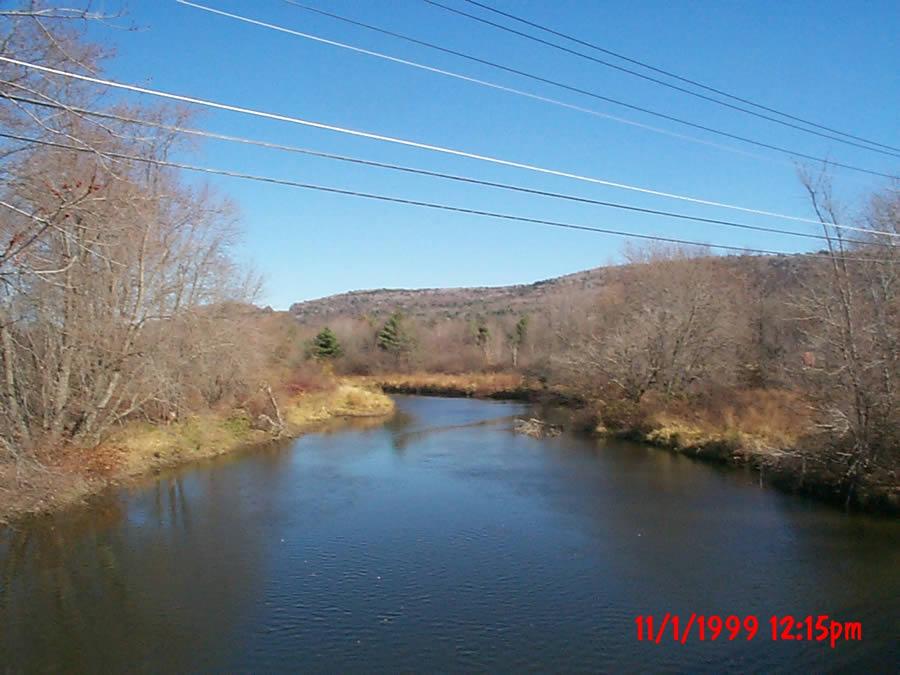
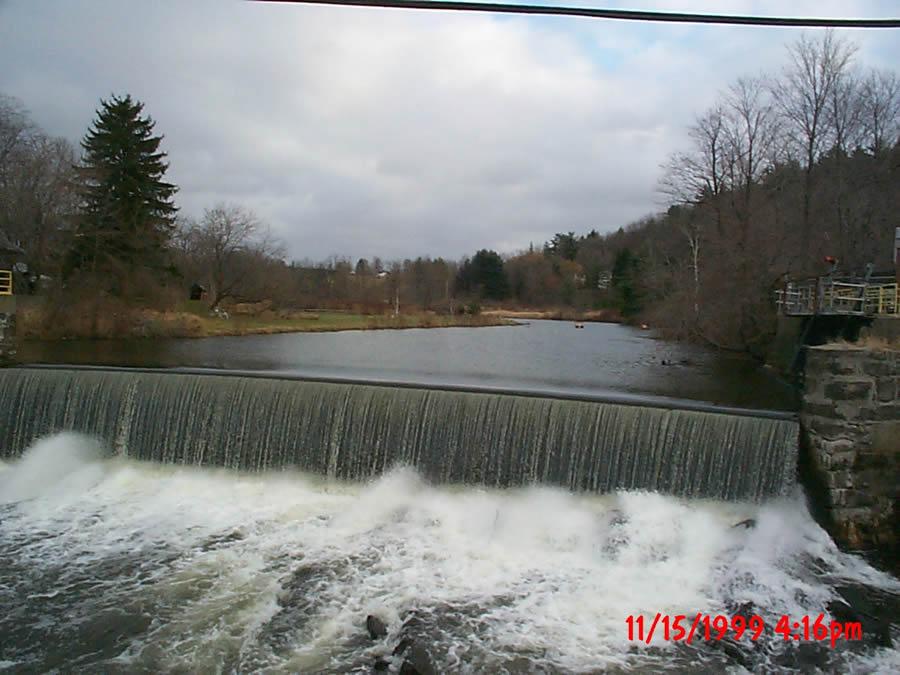
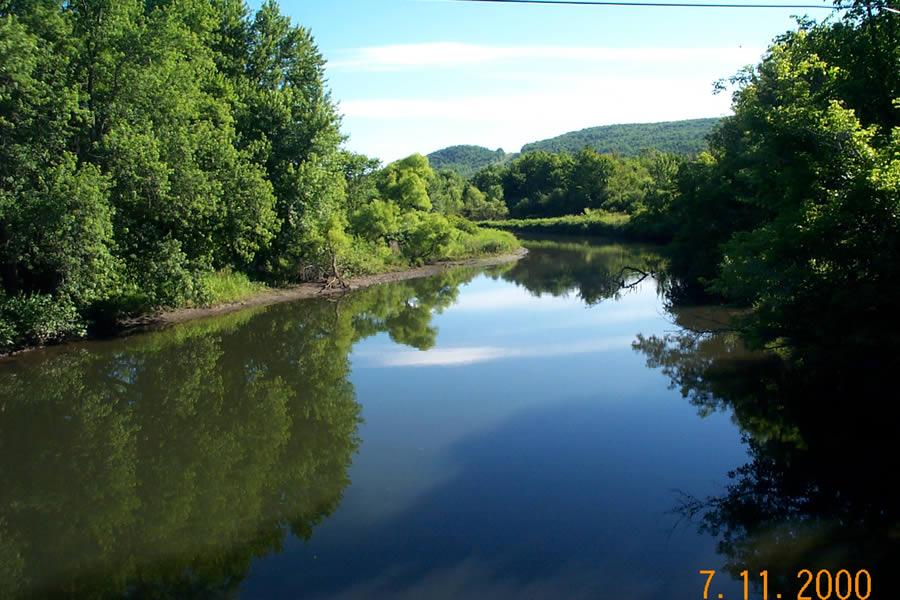
Rest of River is the term used in the Consent Decree to describe the investigation and decision making process for the section of the Housatonic River from the confluence of the East and West Branch downstream into Connecticut.
EPA conducted an investigation of the Rest of River, focusing on the collection of information for Human Health and Ecological Risk Assessments, and the development of the numerical model of PCB fate and transport in the river. Both of the risk assessments and three aspects of the modeling effort were subject to formal Peer Review, with the Peer Review of the Modeling Framework conducted in April 2001, the Human Health Risk Assessment in November 2003, and the Ecological Risk Assessment in January 2004, the Model Calibration Peer Review in May 2004, and the final Modeling Validation Peer Review in June 2006.
Following the completion of the risk assessments, GE prepared a Supplemental RCRA Facility Investigation Report which was approved by EPA in September 2003, and submitted an Interim Media Protection Goals proposal (approved by EPA in 2006). Following completion of EPA’s modeling study, GE prepared the Corrective Measures Study Proposal, which was ultimately approved in August 2007, and the Corrective Measures Study, which was submitted in March 2008 and a Revised Corrective Measures Study which was submitted in October 2010. Following EPA’s review of the Corrective Measures Study, including GE’s recommended alternative, and with consideration of public comments, EPA will select the cleanup alternative (corrective measure[s]) for the Rest of River and propose the preferred alternative for public comment once more. After EPA finalizes the cleanup alternative, GE and/or the public can appeal EPA's decision.
To be a part of the conversations, join us at an upcoming public meeting.
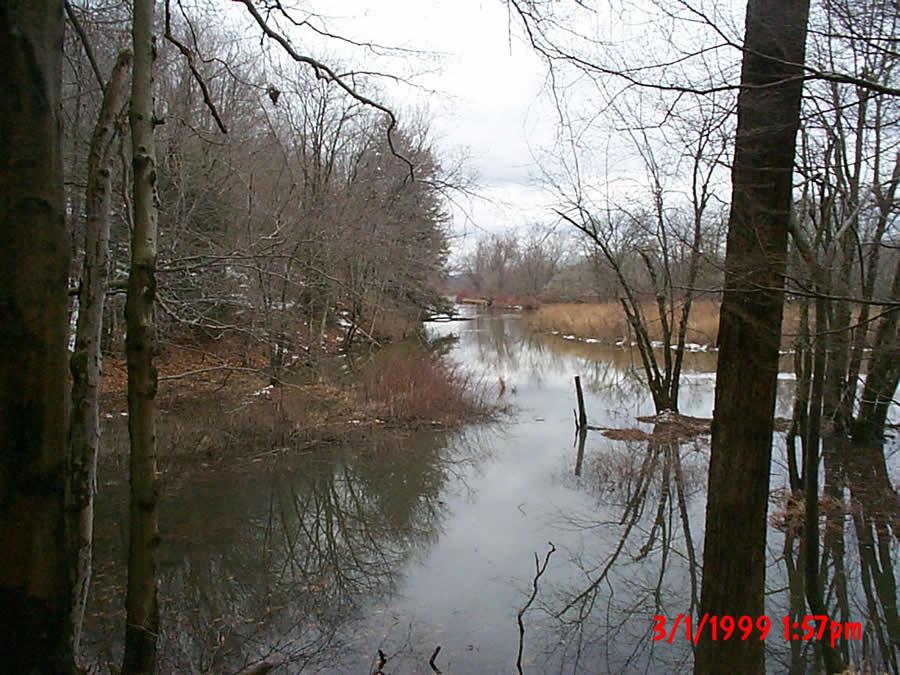
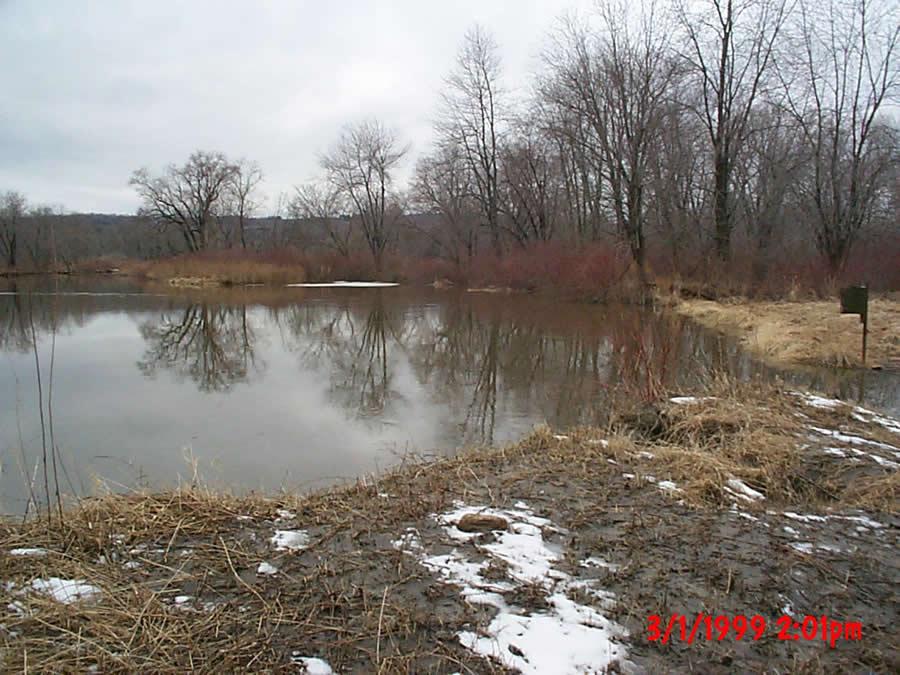
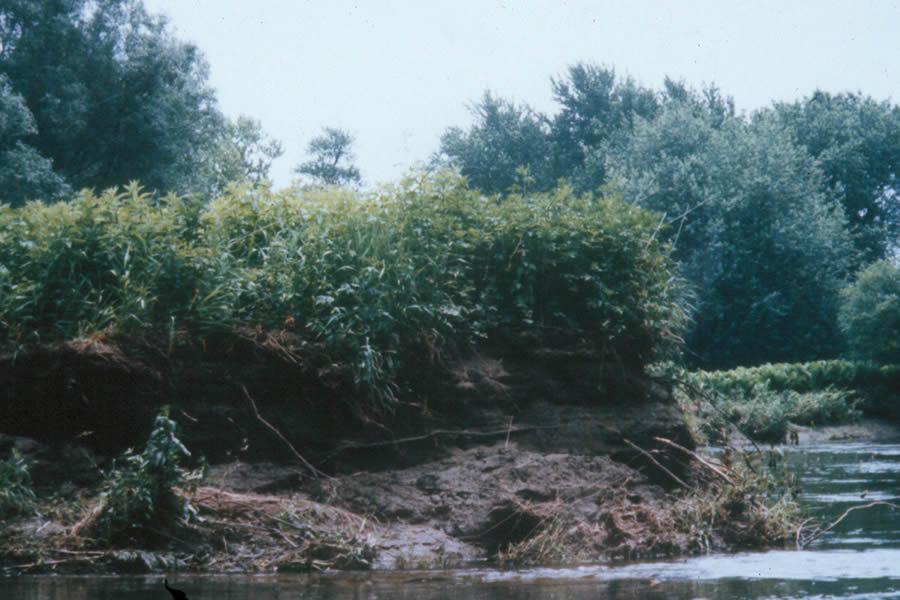
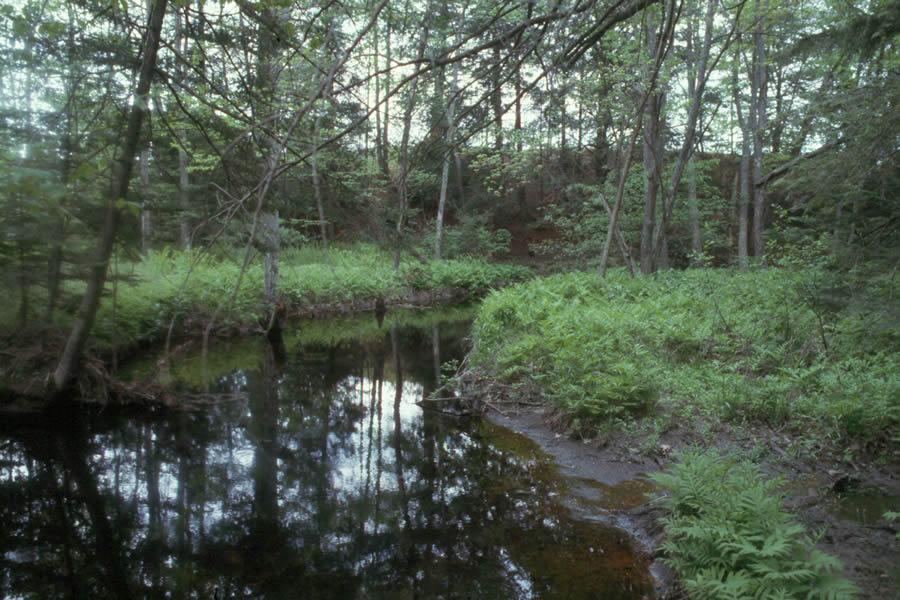
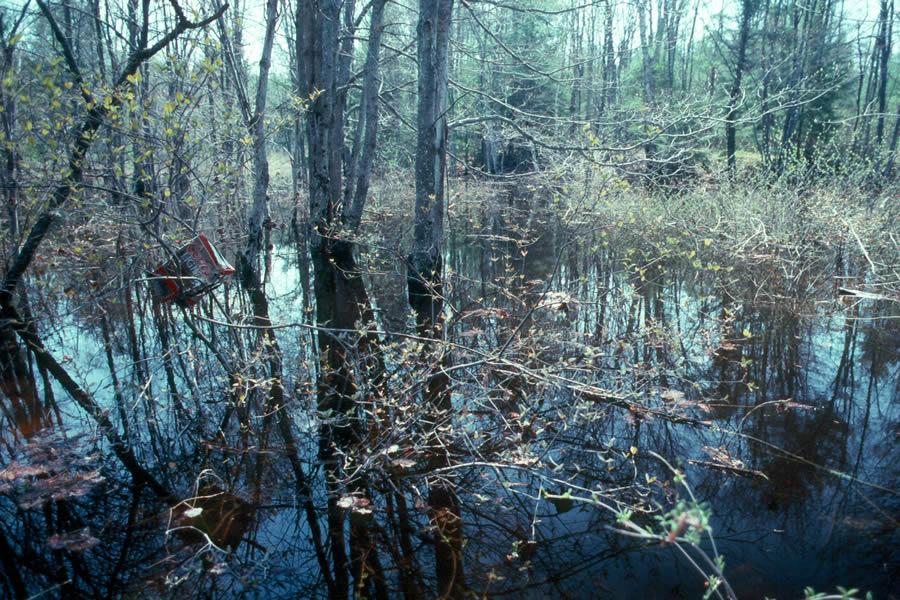
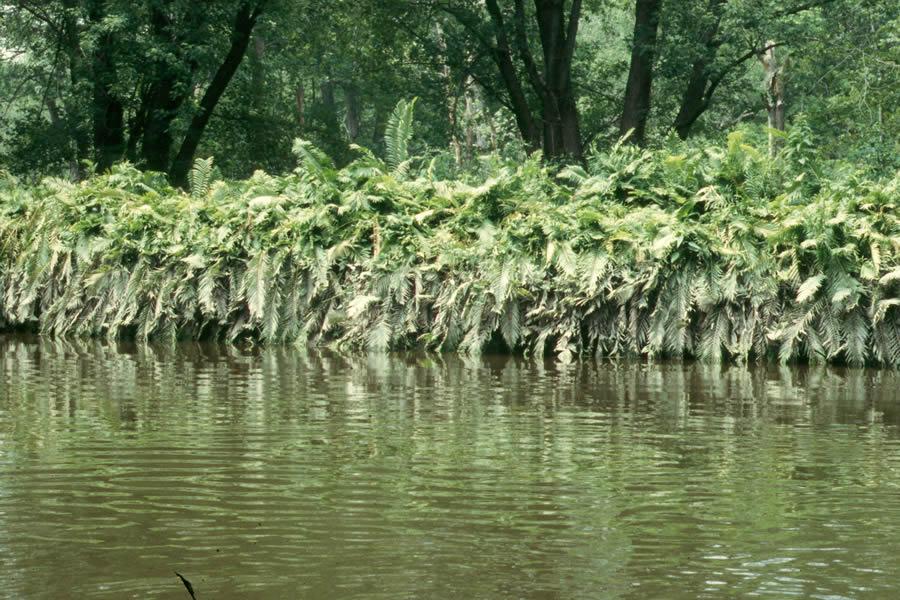
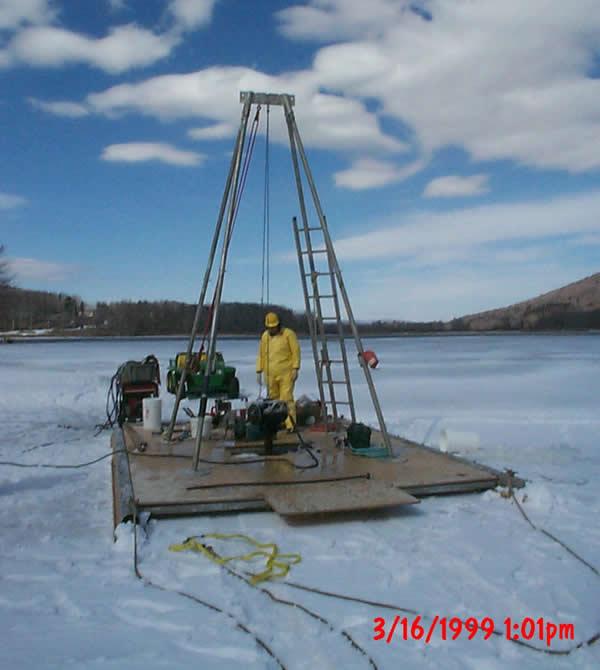
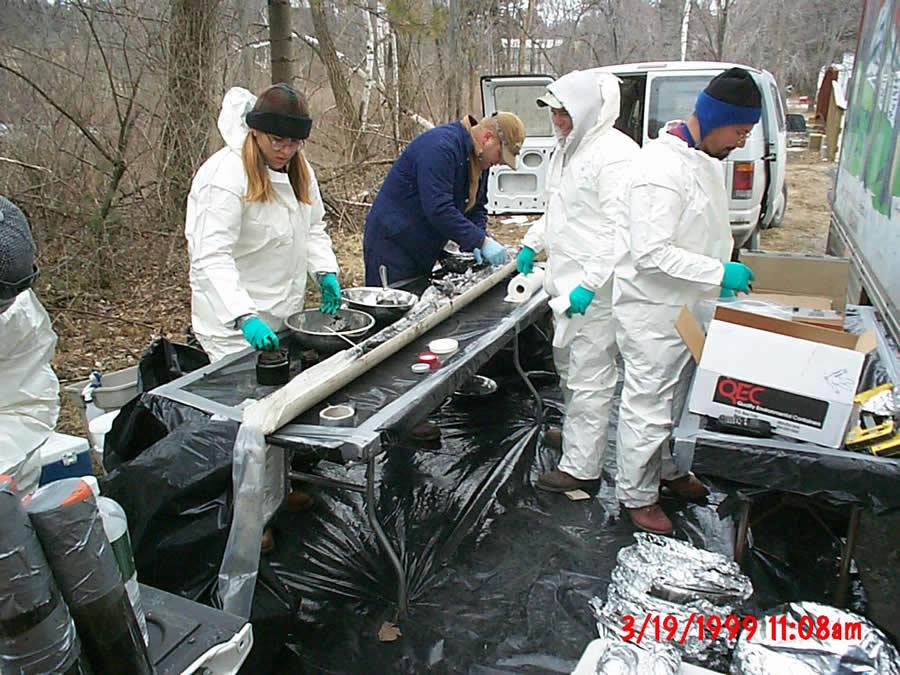
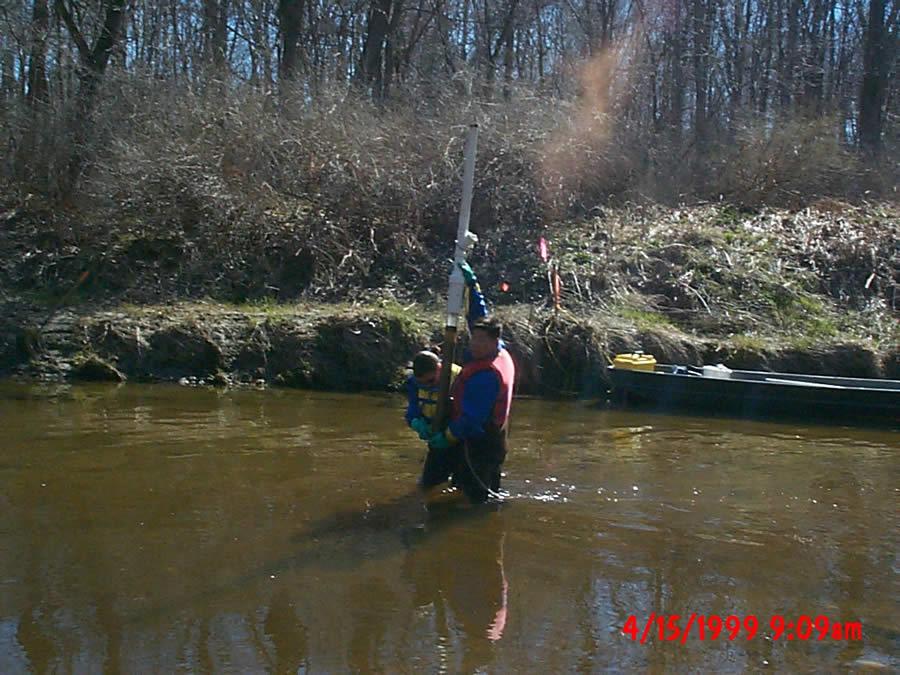
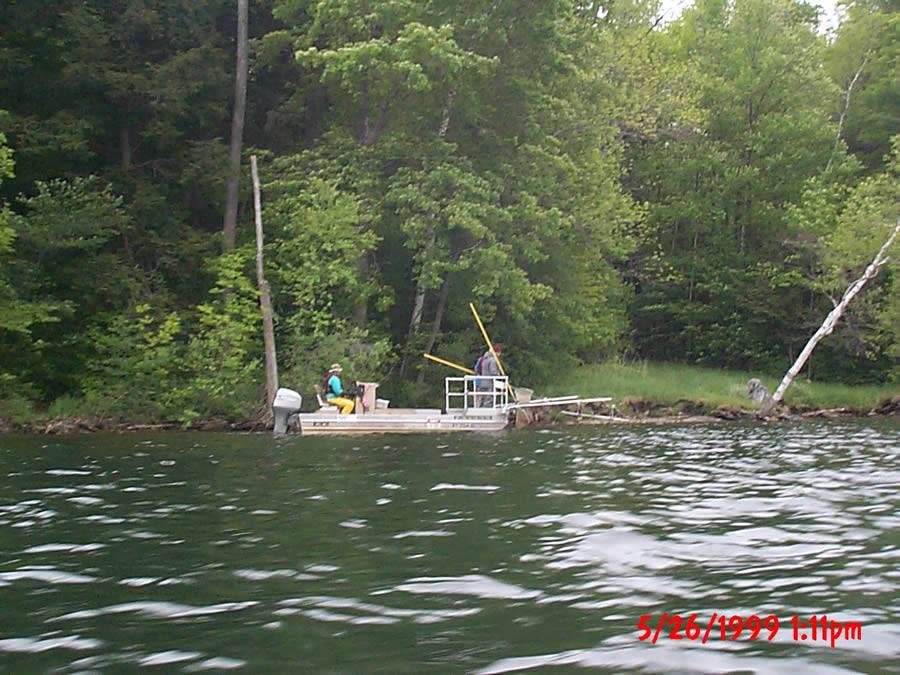
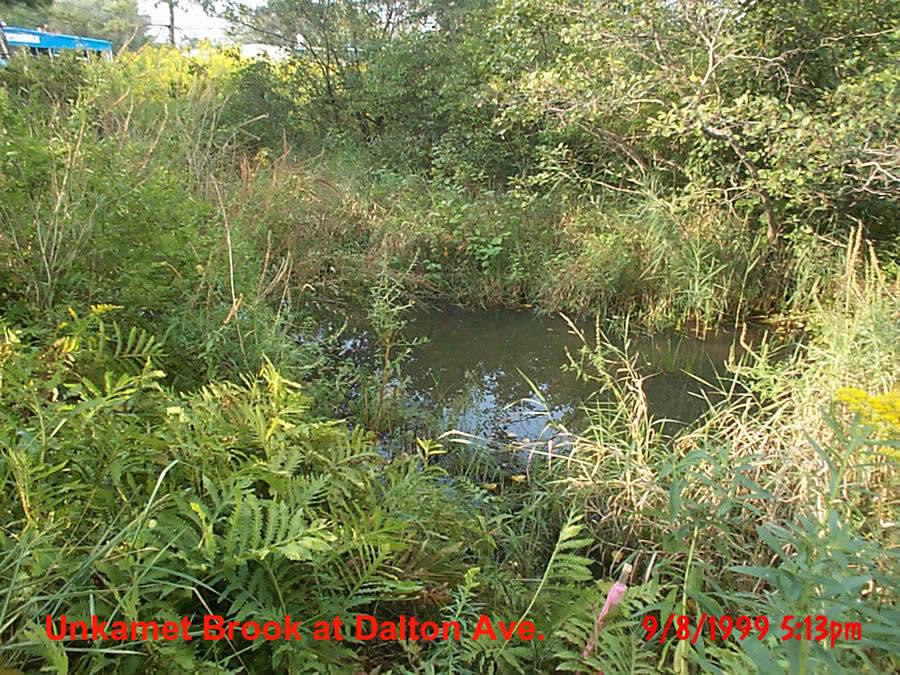
Numerous studies have been conducted since 1988 by different parties, including EPA and GE, which document PCB contamination in sediment, floodplain soil adjacent to the river, and biota. A summary of PCB concentrations that have been observed historically or that were measured by EPA in recent years is provided below.
Rest of River Investigation Results
Sediment
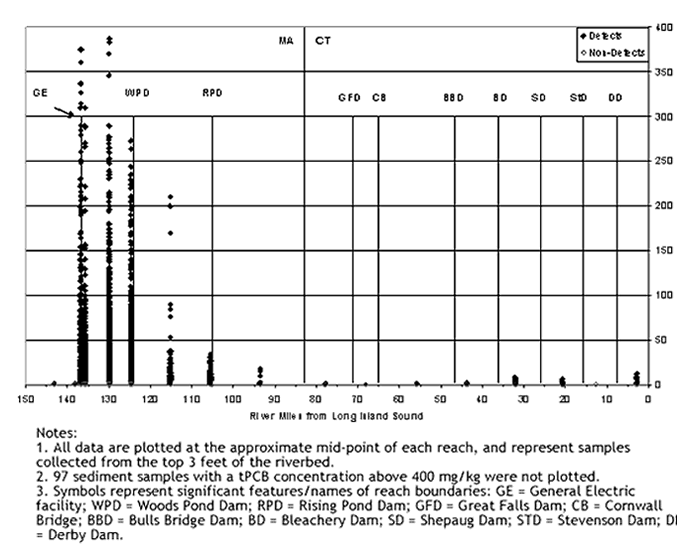
The average PCB concentrations in rivesr sediment, prior to the ½-Mile and 1½-Mile cleanup, were as high as 54,000 ppm in the ½ Mile in the vicinity of the Building 68 spill (average after the Building 68 sediment removal was 54.8 ppm). In the next 1½ miles PCBs were detected as high as 8,635 ppm (average = 25 ppm). In the surface sediment of the Rest of River from the confluence to Woods Pond, PCBs were detected as high as 614 ppm (average = 21 ppm). In the Woods Pond area, levels up to 668 ppm (average = 31 ppm) are present in surface sediment. PCBs have also been detected in river sediments further downstream, as far as impoundments in Connecticut. Figure 1 presents the sediment total PCB concentrations by river mile from the GE Facility to Long Island Sound.
Figure 1 - Sediment tPCB Concentrations by River Mile from the GE Facility to Long Island Sound

Notes:
- All data are plotted at the approximate mid-point of each reach, and represent samples collected from the top 3 feet of the riverbed.
- 97 sediment samples with a total PCB concentration above 400 mg/kg were not plotted.
- Symbols represent significant features/names of reach boundaries: GE = General Electric facility; WPD = Woods Pond Dam; RPD = Rising Pond Dam; GFD = Great Falls Dam; CB = Cornwall Bridge; BBD = Bulls Bridge Dam; BD = Bleachery Dam; SD = Shepaug Dam; STD = Stevenson Dam; DD = Derby Dam.
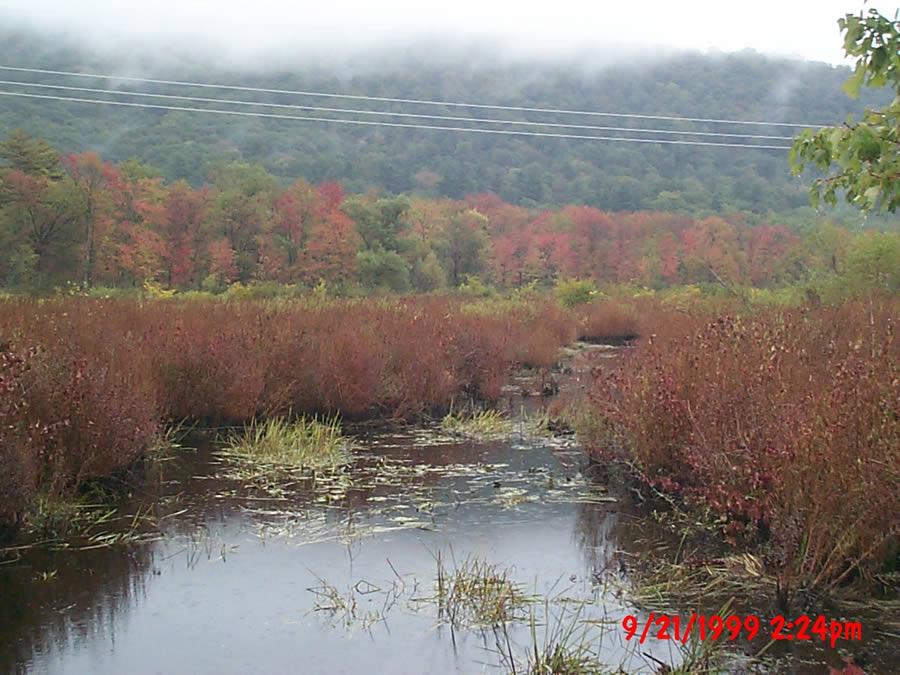
Floodplain Soil
The historical and recently collected data indicate that the floodplain soil PCB contamination (exceeding 1 ppm total PCB) falls within the extent of the river's 10-year floodplain above Woods Pond. The maximum concentration detected in surface floodplain soil above Woods Pond is 874 ppm, with an average of 17 ppm. PCBs are also found in the floodplain south of Woods Pond. The contamination of floodplain soils downstream from the facility resulted from the redistribution of PCBs by river flooding and associated sediment transport.
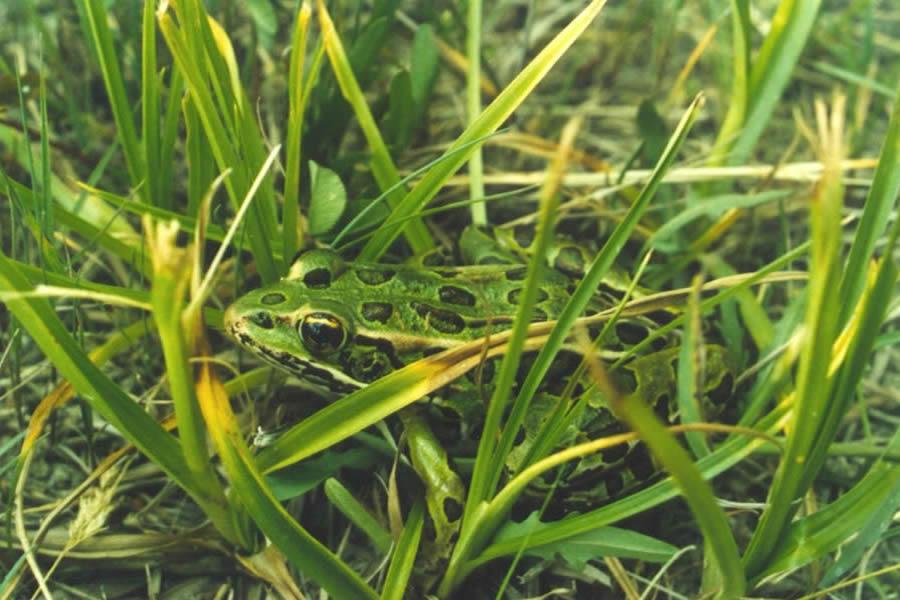
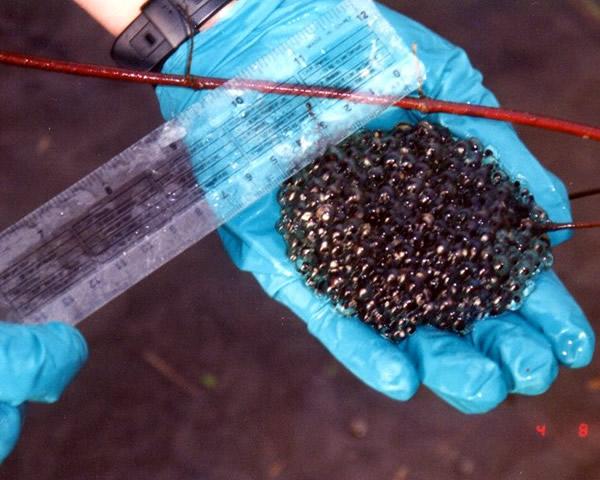
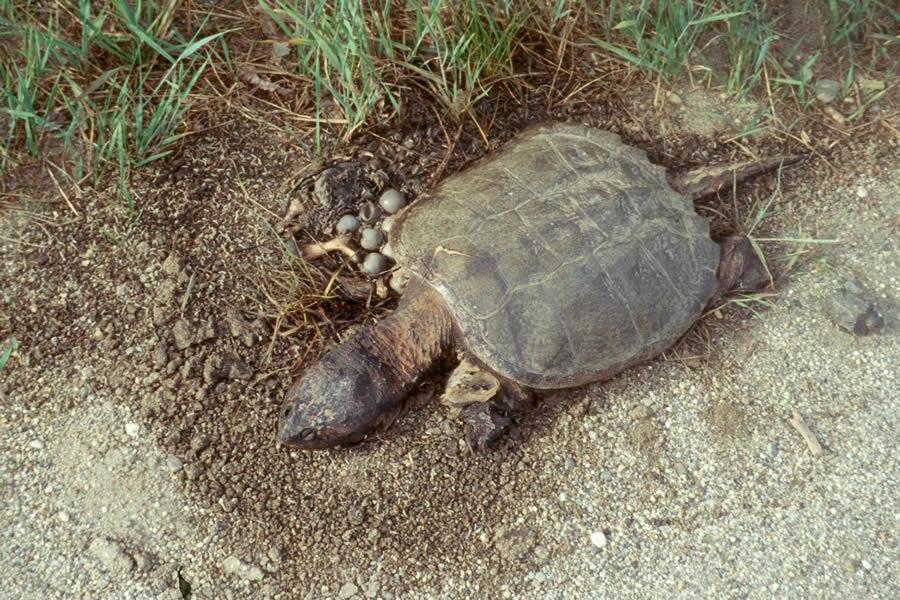
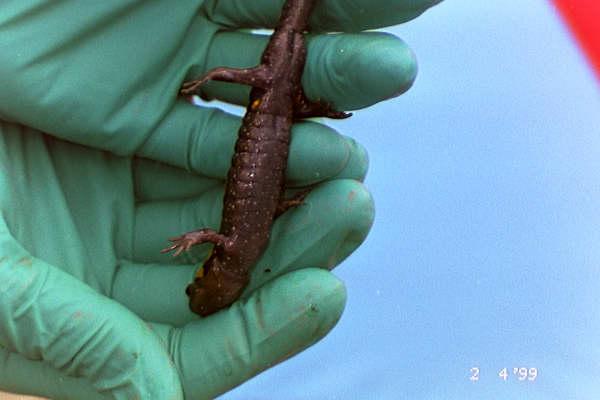
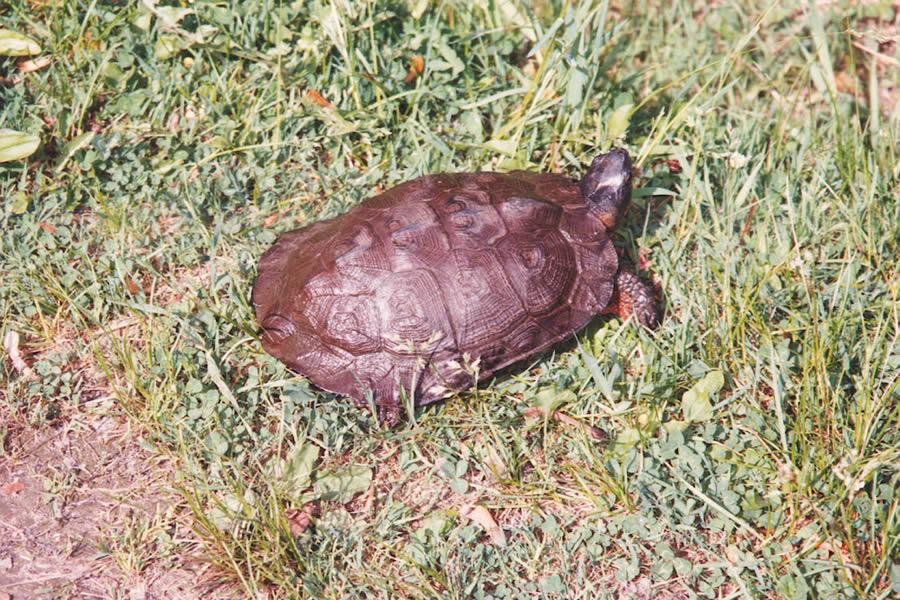
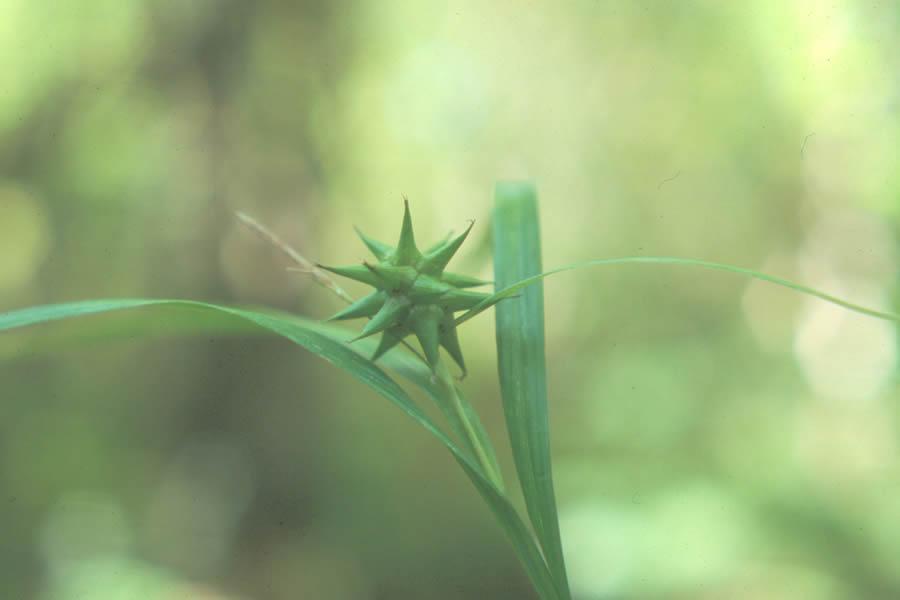
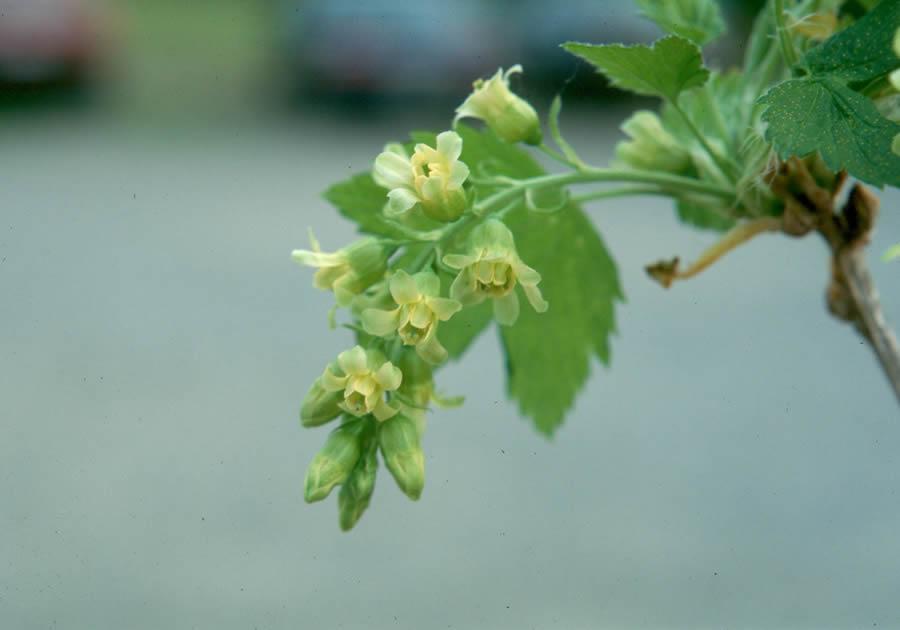
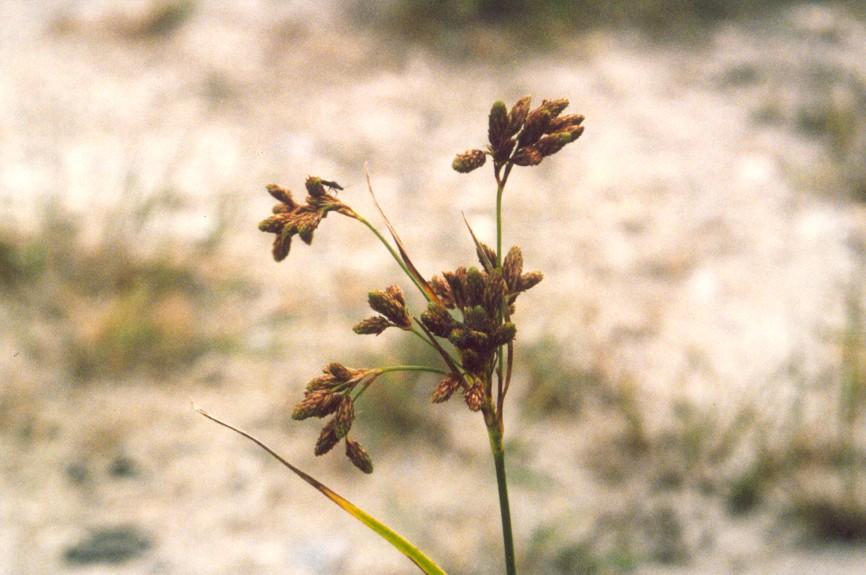
Biota
Representative results from the biota data collection efforts conducted are summarized below.
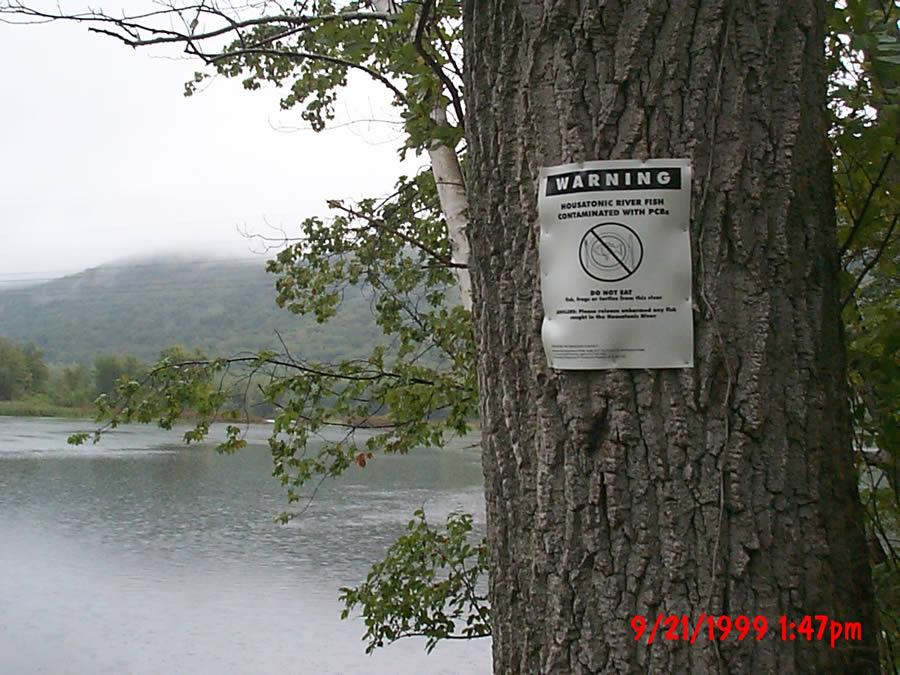
Fish
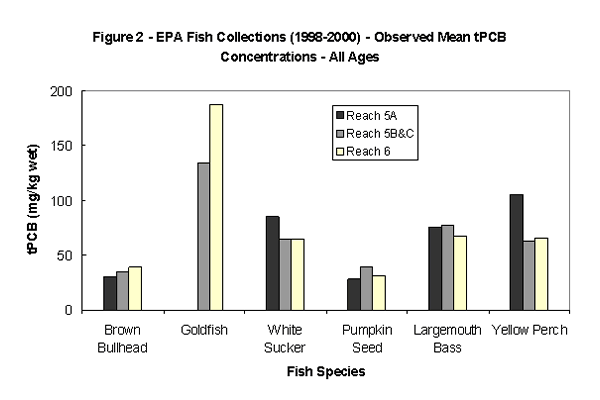
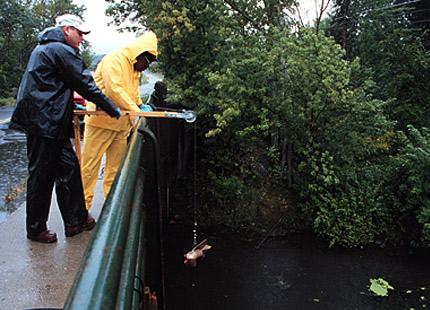
Numerous fish collection efforts have been conducted on the river over the years. In September 1994, 19 individual whole fish were collected with an average PCB concentration of 76 mg/kg/ww (3,378 mg/kg/lipid), and in May 1995, 17 individual whole fish were collected with an average concentration of 112 mg/kg ww (5,258 mg/kg/lipid). EPA also conducted a large-scale fish tissue sampling program in 1998, and smaller-scale sampling events in 1999 and 2000. Recently GE collected fish for analysis in 2011, and has an ongoing program collecting young of year fish every other year.
More than 1,000 fish tissue samples have been collected from individual fish and composite samples of fish. Species of fish sampled include yellow perch, pumpkinseed, bluegill, golden shiner, goldfish, white sucker, carp, largemouth bass, smallmouth bass, brown bullhead, yellow bullhead, and fallfish. The mean total PCB concentrations in whole fish collected by EPA, in Reaches 5 and 6, is presented in Figure 2.
 - Observed Mean tPCB Concentrations - All Ages") View a larger version of this image.
View a larger version of this image.
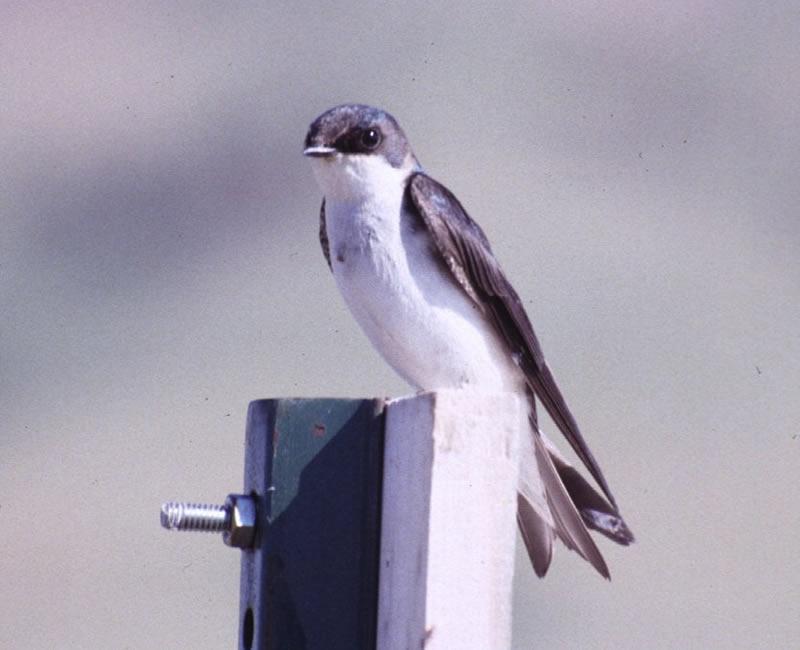
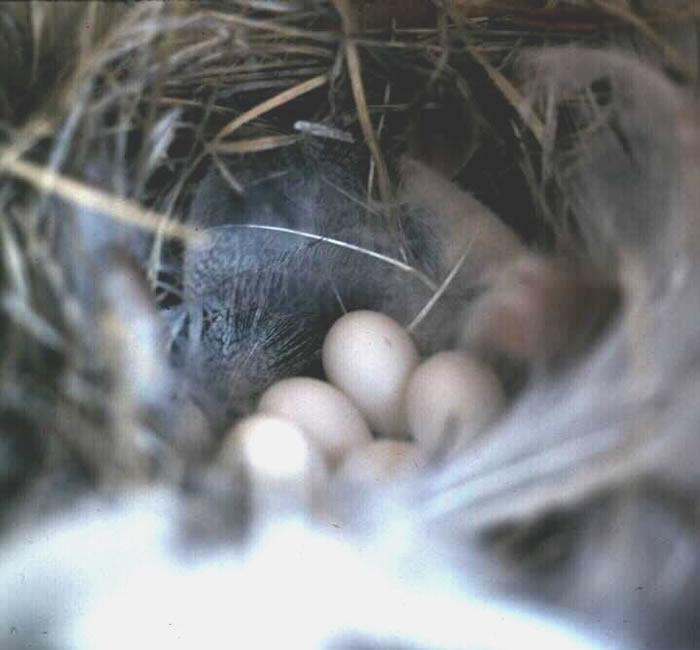
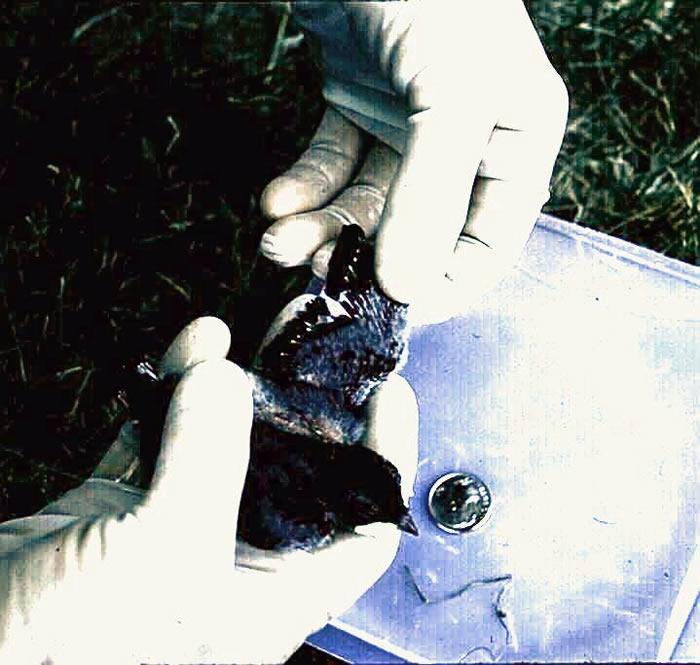
Birds
Waterfowl samples were collected by EPA from the vicinity of Woods Pond in August and September of 1998. Two species were collected, wood ducks and mallards, including both adults and immature birds, for a total of 25 birds from the river and 20 from a reference area away from the Rest of River. The birds collected on the river were primarily summer residents (based upon ongoing observations by project biologists and on the development of the immature birds), while the reference area birds were believed to have been transients (for the same reasons). Concentrations of PCBs in breast tissue (skin on) from river birds averaged 7.1 mg/kg ww (648 mg/kg lipid) and in liver tissue averaged 10.6 mg/kg ww (262 mg/kg lipid). Maximum concentrations were 19.4 (3700 mg/kg lipid) and 38.6 (985 mg/kg lipid), respectively.
Reports for the Rest of River
- Rest of River Final Permit Modification, Selection of Remedial Action and Response to Comments
- Intended Final Decision on Rest of River Cleanup Plan and Related Correspondence
- Rest of River Biota Consumption Advisories
- Rest of River Proposed Remedial Action, Supporting Documentation, and Public Comment
- Rest of River Discussions between Government Agencies and GE conducted from 8/2012 through 12/2013
- Rest of River Community Updates
- Rest of River Corrective Measures Studies and Public Comments
- Rest of River Corrective Measures Study Proposal and Public Comments
- Rest of River Ecological Risk Assessment Documents, Peer Review and Public Comments
- Additional Rest of River Documents and Correspondence
- Rest of River Human Health Risk Assessment Documents, Peer Review and Public Comments
- Rest of River Interim Media Protection Goals Documents and Public Comments
- Rest of River Modeling Documents, Peer Review and Public Comments
- Rest of River RCRA Facility Investigation Report and Related Investigation Documents
- Rest of River Remedy Review Board Documents
Maps and Figures for the Rest of River
These figures represent a visualization of PCB concentrations in soils and sediments of the Housatonic River and floodplain between Pittsfield and Lenox, Massachusetts as determined from data collected by EPA and others prior to September 20, 2000 and are subject to revision based on subsequent data collection and assessment.
Figures:
Maps:
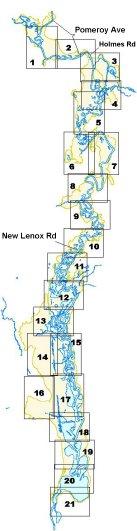
Total PCB Results for
Reaches 5 & 6
- Tile 1 (PDF) (pg 1 of 21 pp, 19.8 MB)
- Tile 2 (PDF) (pg 2 of 21 pp, 19.8 MB)
- Tile 3 (PDF) (pg 3 of 21 pp, 19.8 MB)
- Tile 4 (PDF) (pg 4 of 21 pp, 19.8 MB)
- Tile 5 (PDF) (pg 5 of 21 pp, 19.8 MB)
- Tile 6 (PDF) (pg 6 of 21 pp, 19.8 MB)
- Tile 7 (PDF) (pg 7 of 21 pp, 19.8 MB)
- Tile 8 (PDF) (pg 8 of 21 pp, 19.8 MB)
- Tile 9 (PDF) (pg 9 of 21 pp, 19.8 MB)
- Tile 10 (PDF) (pg 10 of 21 pp, 19.8 MB)
- Tile 11 (PDF) (pg 11 of 21 pp, 19.8 MB)
- Tile 12 (PDF) (pg 12 of 21 pp, 19.8 MB)
- Tile 13 (PDF) (pg 13 of 21 pp, 19.8 MB)
- Tile 14 (PDF) (pg 14 of 21 pp, 19.8 MB)
- Tile 15 (PDF) (pg 15 of 21 pp, 19.8 MB)
- Tile 16 (PDF) (pg 16 of 21 pp, 19.8 MB)
- Tile 17 (PDF) (pg 17 of 21 pp, 19.8 MB)
- Tile 18 (PDF) (pg 18 of 21 pp, 19.8 MB)
- Tile 19 (PDF) (pg 19 of 21 pp, 19.8 MB)
- Tile 20 (PDF) (pg 20 of 21 pp, 19.8 MB)
- Tile 21 (PDF) (pg 21 of 21 pp, 19.8 MB)
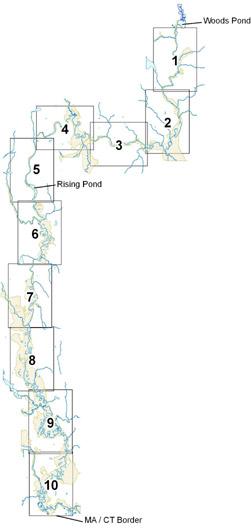
Total PCB Results for Reaches 7, 8, & 9
- Tile 1 (PDF) (pg 1 of 21 pp, 2 MB)
- Tile 2 (PDF) (pg 2 of 21 pp, 2 MB)
- Tile 3 (PDF) (pg 3 of 21 pp, 2 MB)
- Tile 4 (PDF) (pg 4 of 21 pp, 2 MB)
- Tile 5 (PDF) (pg 5 of 21 pp, 2 MB)
- Tile 6 (PDF) (pg 6 of 21 pp, 2 MB)
- Tile 7 (PDF) (pg 7 of 21 pp, 2 MB)
- Tile 8 (PDF) (pg 8 of 21 pp, 2 MB)
- Tile 9 (PDF) (pg 9 of 21 pp, 2 MB)
- Tile 10 (PDF) (pg 10 of 21 pp, 2 MB)
- Columbia Mill Dam Sediment and Soil Total PCB Results (PDF) (12 pp, 913 K)


 Floodplain")
 Floodplain")
")


 egg mass")
")
")


")
")
")
")
")


