Light-Duty Automotive Technology, Carbon Dioxide Emissions, and Fuel Economy Trends Report Overview
Trends is the authoritative reference for carbon dioxide (CO2) emissions, fuel economy, and technology trends in the automotive industry from model year 1975-2016.
This report is published annually to summarize trends in EPA’s best estimate of real world tailpipe carbon dioxide (CO2) emissions and fuel economy, and associated technologies. The Trends database has been maintained by EPA since 1975, and is the most comprehensive of its kind.
All data are based on annual production volumes of new personal vehicles, including passenger cars, sport utility vehicles, minivans, and all but the largest pickup trucks and vans.
- EPA’s annual report shows model year (MY) 2015 fuel economy is at a record high and CO2 emissions are at a record low.
- MY 2015 fuel economy averaged 24.8 mpg, and CO2 emissions averaged 358 grams per mile
- Fuel economy has increased by 5.5 mpg, or 28%, since MY 2004
- All vehicle types are at or near record high fuel economy
Click on an individual highlight to expand.
Executive Summary - Highlights
- 1: Average new vehicle CO2 emissions are at a record low, and fuel economy is at a record high for MY 2015
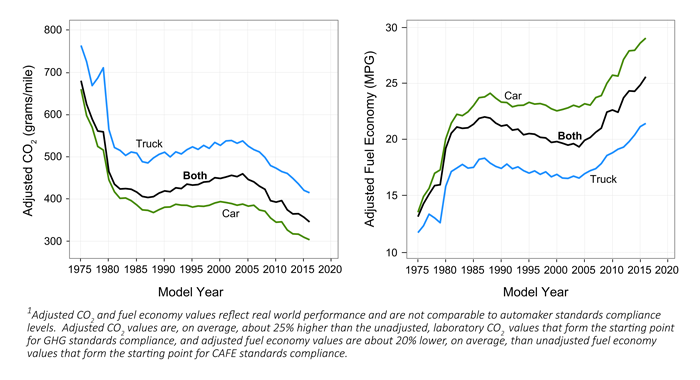
The final MY 2015 adjusted, real world CO2 emissions rate for all new personal vehicles is 358 g/mi, which is an 8 g/mi decrease from MY 2014 and the lowest level ever. The MY 2015 adjusted fuel economy is 24.8 mpg, which is 0.5 mpg higher than MY 2014 and is a record high.
Both cars and trucks reached record adjusted fuel economy in MY 2015. The average MY 2015 adjusted fuel economy for cars increased to 28.6 mpg, a 0.7 mpg increase over MY 2014. MY 2015 trucks also increased 0.7 mpg to 21.1 mpg.
The greatest value of the historical Trends database is the documentation of long-term trends. CO2 emissions and fuel economy have improved in nine out of the last eleven years, and decreased only once. Based on the final data through MY 2015, CO2 emissions have decreased by 103 g/mi, or 22%, since MY 2004, and fuel economy has increased by 5.5 mpg, or 28%, with an average annual improvement of about 0.5 mpg per year.
Preliminary MY 2016 adjusted CO2 emissions are projected to be 347 g/mi and fuel economy is projected to be 25.6 mpg, which would be a further improvement over MY 2015. These values are based on production estimates provided by automakers throughout 2015. MY 2016 values will be finalized in next year’s report.
Adjusted CO2 Emissions for MY 1975-20161 Adjusted Fuel Economy for MY 1975-20161
- 2: Fuel economy continues to increase while weight and power have leveled off
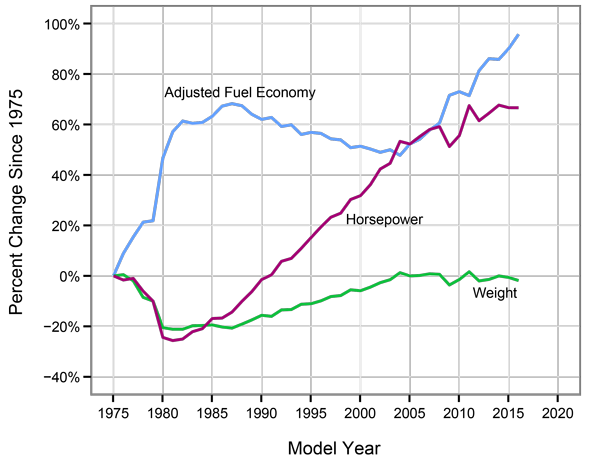
Vehicle weight and power are two important design parameters that help determine a vehicle’s CO2 emissions and fuel economy.
For nearly two decades through MY 2004, on a fleetwide basis, automotive technology innovation was generally utilized to support vehicle attributes other than CO2 emissions and fuel economy, such as weight, performance, utility, and other attributes. Beginning in MY 2005, technology has generally been used to increase both fuel economy (which has reduced CO2 emissions) and power, while keeping vehicle weight relatively constant.
The average weight for new vehicles produced in MY 2015 was 4,035 pounds, a decrease of 25 pounds (less than a 1% change) compared to MY 2014. The weight of an average new car was flat, while the weight of an average new truck fell by 110 pounds. The 2% increase in truck share offset the weight reductions in trucks so that overall new vehicle weight was relatively unchanged.
Average new vehicle horsepower (hp) was also basically unchanged in MY 2015, as the average vehicle was 1 hp lower than MY 2014. With an average 229 hp, new vehicles are 1 hp below the record set in MY 2014 and MY 2011. Car horsepower was down by 1 hp and truck horsepower was down by 6 hp. The average 0-to-60 mph acceleration time was down by about 0.1 seconds in MY 2015.
Preliminary MY 2016 values suggest that average weight will be down about 50 pounds and horsepower will remain at 229 hp. EPA will not have final MY 2016 data until next year’s report.
Change in Adjusted Fuel Economy, Weight, and Horsepower for MY 1975-2016
- 3: Sport utility vehicles reached record high market share, while also achieving record low CO2 emissions and record high fuel economy
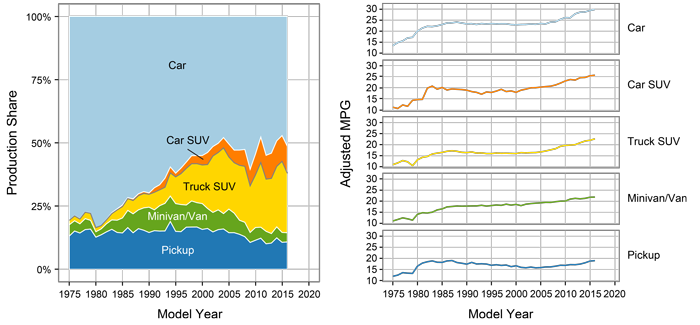
In this report, vehicles are disaggregated into five vehicle types: car, car SUV, truck SUV, pickup truck, and minivan/van. Car SUVs are generally smaller 2WD SUVs that are considered cars for purposes of compliance with the GHG emissions and fuel economy standards.
Truck SUVs had the largest production share increase of any vehicle type in MY 2015, up 4 percentage points to a record 28% of all production. Car SUVs achieved record market share of 10%, resulting in a record 38% market share for combined SUVs in MY 2015. Both car SUVs and truck SUVs achieved record high fuel economy and record low CO2 emissions with car SUVs reaching 25.3 mpg and truck SUVs reaching 22.0 mpg.
Pickup trucks had the largest increase in fuel economy of any vehicle type in MY 2015, increasing by 0.8 mpg. Pickup trucks are now at their second highest recorded fuel economy, only slightly behind MY 1986 (when trucks were much smaller and on average weighed one third less than new trucks today).
All five vehicle types have steadily increased fuel economy in recent years and are at or near their record high fuel economy. However, the market shift towards SUVs has offset some of the fleetwide benefits that otherwise would have been achieved due to the increased fuel economy within each vehicle type. Light trucks, which include pickups, truck SUVs, and minivans/vans, increased market share 2 percentage points in MY 2015, to 43% of production. This remains below the record light truck share of 48% reached in MY 2004.
Preliminary MY 2016 data suggests that overall truck share will drop in MY 2016; however this projection is particularly uncertain given market conditions and low gasoline prices.
Production Share and Adjusted Fuel Economy by Vehicle Type for MY 1975-2016
- 4: Average new vehicle footprint is relatively stable
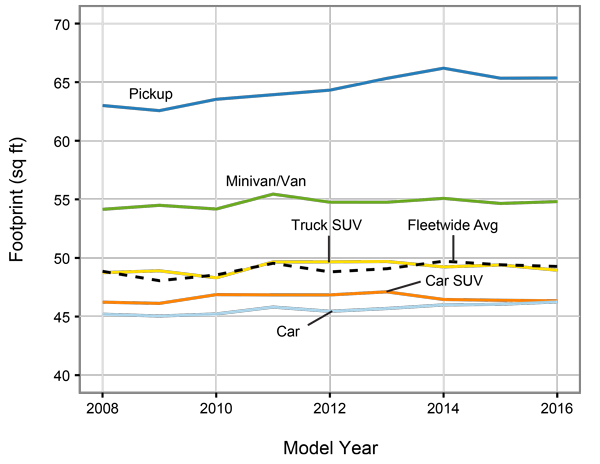
Footprint is an important measure of vehicle size that is defined as the area enclosed by the tires of the vehicle (i.e., wheelbase multiplied by average track width). Both the GHG emissions and fuel economy standards rely on footprint to determine vehicle GHG and fuel economy targets. EPA began collecting industry-wide footprint data in MY 2008.
The most notable change in footprint has occurred in pickup trucks. Average new pickup truck footprint increased nearly 4% between MY 2008 and MY 2015, to an average of 65.3 ft2. Footprint for pickups did decrease slightly in MY 2015, down from the record 66.2 ft2 reached in MY 2014.
The average footprint within each of the four other vehicle types has been relatively stable between MY 2008 and MY 2015. The average footprint for cars (excluding car SUVs) increased about 2%, to 46.0 ft2. Truck SUVs increased slightly (1.3%) to 49.4 square feet, and car SUVs increased very slightly (0.3%) to 46.4 ft2. Minivans/vans also increased slightly (0.9%) to 54.6 ft2.
The overall new vehicle average footprint has also been relatively stable between MY 2008 and MY 2015. The overall average is influenced by the trends within each vehicle type, as well as the mix of new vehicles produced. Since MY 2008, market share has shifted towards car SUVs and trucks SUVs, and away from cars, pickups, and minivans/vans. The result of this shift, and the accompanying footprint changes within each vehicle type, is that between MY 2008 and MY 2015 the overall industry footprint increased by 0.5 ft2, or about 1%, to 49.4 ft2.
Preliminary MY 2016 values are essentially unchanged from MY 2015. The overall new vehicle average footprint is projected to drop by 0.1 ft2, to 49.3 ft2.
Footprint by Vehicle Type for MY 2008-2016
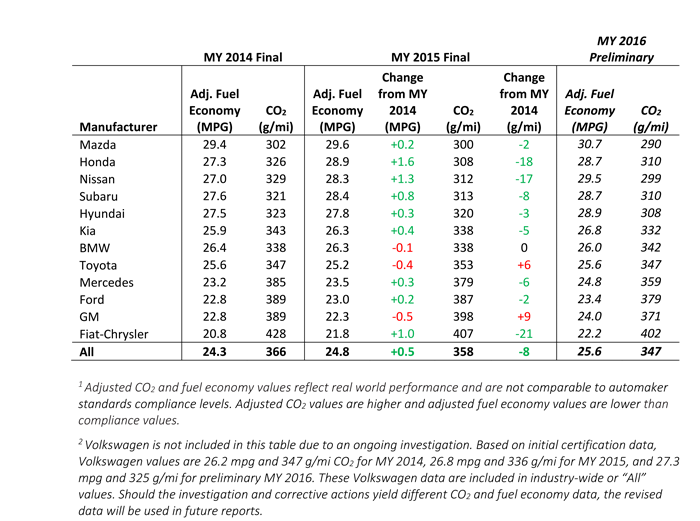
- 5: Most manufacturers decreased CO2 emissions and improved fuel economy in MY 2015
Nine of the twelve manufacturers shown below increased fuel economy and decreased CO2 emissions from MY 2014 to MY 2015, the last two years for which we have final data.
In MY 2015, Mazda had the lowest fleetwide average adjusted CO2 emissions and highest adjusted fuel economy performance, followed closely by Honda, Nissan, Subaru, and Hyundai. Fiat-Chrysler had the highest CO2 emissions and lowest fuel economy, although it also achieved the largest reduction in adjusted CO2 emissions from MY 2014 to MY 2015. Honda and Nissan had the next largest reductions in adjusted CO2 emissions from MY 2014 to MY 2015.
Two manufacturers increased average adjusted CO2 emissions between MY 2014 and MY 2015, largely due to increasing truck share. Truck share increased 11 percentage points for GM and 7 percentage points for Toyota. Both companies actually improved their average truck CO2 emissions, but their overall emissions increased due to increasing truck share.
Preliminary values suggest that most manufacturers will improve in MY 2016 as well, though these projections are uncertain, and EPA will not have final MY 2016 data until next year’s report.
MY 2014-2016 Manufacturer Adjusted Fuel Economy and Adjusted CO2 Emissions1, 2
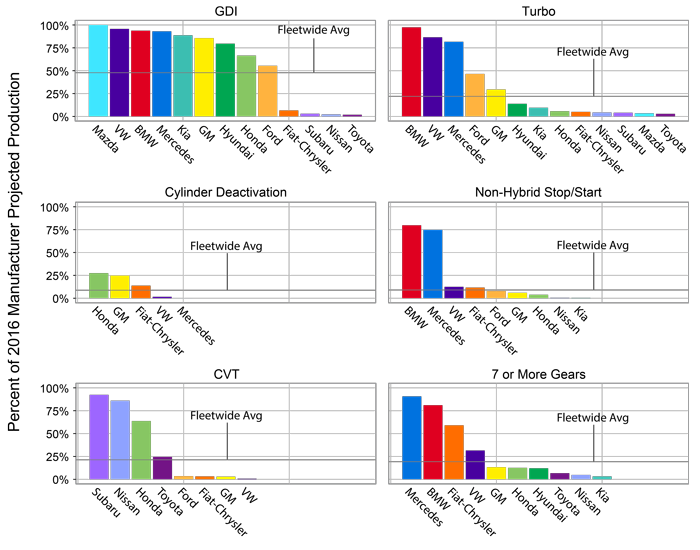
- 6: Manufacturers continue to adopt a wide array of advanced technologies
Technological innovation is a major driving force in the industry. The industry overall has adopted several technologies quickly in recent years, however individual manufacturers are clearly utilizing different technologies to achieve CO2 emissions, fuel economy, and performance goals. The figure below illustrates projected manufacturer-specific technology adoption for MY 2016.
Gasoline direct injection (GDI) has achieved widespread use by many manufacturers and is projected to be used on nearly half of all vehicles in MY 2016. This is particularly impressive since GDI was used in less than 3% of vehicles as recently as MY 2008. All Mazda engines are projected to use GDI in MY 2016, with several other manufacturers at nearly 100% adoption. Turbochargers, which are often used in conjunction with GDI, have also increased market share to about 22% in MY 2016, led by BMW, VW, Mercedes, and Ford.
Transmission technology has also changed rapidly with nearly 20% of MY 2016 vehicles projected to use transmissions with seven or more speeds, and an additional 21% relying on continuously variable transmissions (CVT). Subaru, Nissan, and Honda are leading in adoption of CVTs, while Mercedes, BMW, and Fiat-Chrysler lead in the adoption of transmissions with seven or more speeds. BMW and Mercedes are the leading manufacturers for non-hybrid stop/start, and Honda and GM are utilizing cylinder deactivation the most.
Manufacturer Adoption of Emerging Technologies for MY 2016
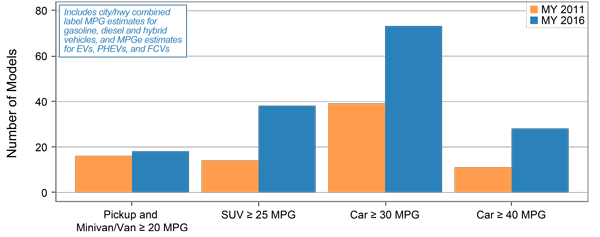
- 7: Consumers have an increasing number of high fuel economy/low CO2 vehicle choices
In MY 2016, consumers have many more choices when shopping for vehicles with higher fuel economy and lower tailpipe CO2 emissions compared to MY 2011. These choices reflect both a more diverse range of technology packages on conventional gasoline and diesel vehicles as well as an increasing number of alternative fuel vehicle offerings.
There are 18 MY 2016 pickup and minivan/van models for which at least one variant of the model has a combined city/highway label fuel economy rating of 20 mpg or more, a small increase over MY 2011. There are more than twice as many SUV models that achieve 25 mpg or more in MY 2016 than there were in MY 2011. The number of car models, where at least one variant has a combined city/highway label fuel economy of at least 30 mpg, has grown from 39 models in MY 2011 to more than 70 models in MY 2016, and the number of car models with 40 mpg or more has more than doubled (comprised of hybrid, electric, plug-in hybrid electric, and fuel cell vehicles).
Vehicle Models Meeting Fuel Economy Thresholds in MY 2011 and MY 2016
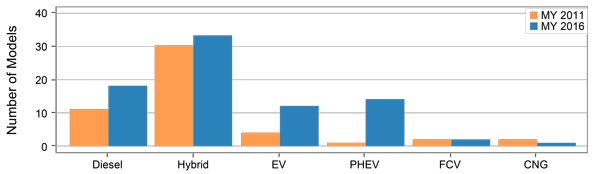
In MY 2016 compared to MY 2011, there are also more advanced technology vehicle choices in most categories, including more than 25 electric and plug-in hybrid electric vehicles.
Advanced Technology and Alternative Fuel Vehicle Models in MY 2011 and MY 2016
- 8: Manufacturers are producing many vehicles today that can meet or exceed future CO2 emissions targets
EPA evaluated MY 2016 vehicle emissions against future footprint-based CO2 regulatory targets to determine which current vehicles could meet or exceed their future targets. These comparisons assume future improvements only in air conditioner refrigerants and efficiency, since these improvements are considered to be among the least expensive methods to reduce greenhouse gas emissions.
It is important to note that there are no CO2 emissions standards for individual vehicles. Overall manufacturer compliance is determined based on the manufacturer specific production-weighted average footprint and CO2 emissions. Because of this averaging, manufacturers will likely be able to achieve compliance with roughly 50% of their vehicles meeting or exceeding the standards.
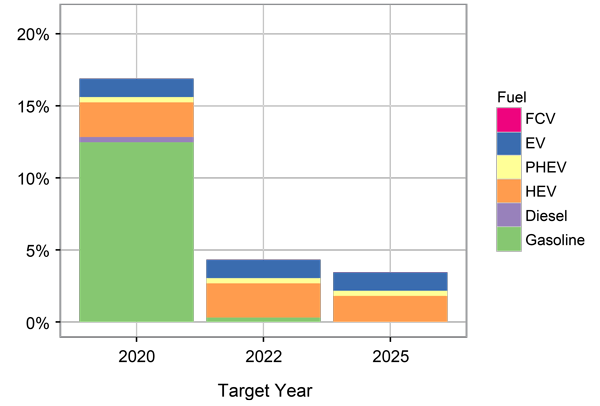
The figure below shows that 17% of projected MY 2016 vehicle production already meets or exceeds the MY 2020 CO2 emissions targets, with the addition of expected air conditioning improvements. This represents more than 2.5 million vehicles being sold today. The number of MY 2016 vehicles meeting or exceeding the 2020 standards is much higher than projections for earlier model years. In previous reports, EPA projected that 11% of MY 2015 vehicles and 5% of MY 2012 vehicles could meet or exceed 2020 standards. The MY 2016 vehicles that meet or exceed the MY 2020 standards are largely non-hybrid gasoline vehicles. This is also a significant change from the MY 2012 projections, where the majority of the vehicles meeting the MY 2020 standards were hybrids.
Looking ahead, about 3.5% of projected MY 2016 production could meet the MY 2025 CO2 emissions targets. Vehicles meeting the MY 2025 CO2 targets are comprised solely of hybrids, plug-in hybrids, electric vehicles and hydrogen fuel cell vehicles. Since the MY 2025 standards are nearly a decade away, there’s considerable time for continued improvements in gasoline vehicle technology to occur.
MY 2016 Vehicle Production That Meets or Exceeds Future CO2 Emissions Targets
See the Executive Summary for a PDF version of the Highlights.