Fiscal Year 2013 National Priorities List Program Snapshot
- NPL Federal Facilities by Agency
- Status of NPL Federal Facilities
- Regional Percentage Distribution of Fiscal Year 2013 Accomplishments
- Current Site Work
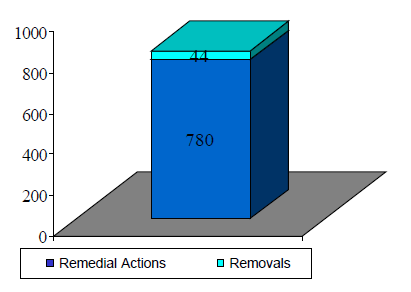
- Completed Site Work
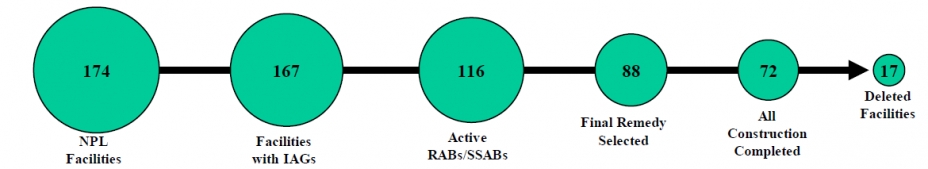
- NPL Federal Facility Site Cleanup Pipeline
- Interagency Agreements
- Institutional Controls at NPL Facilities
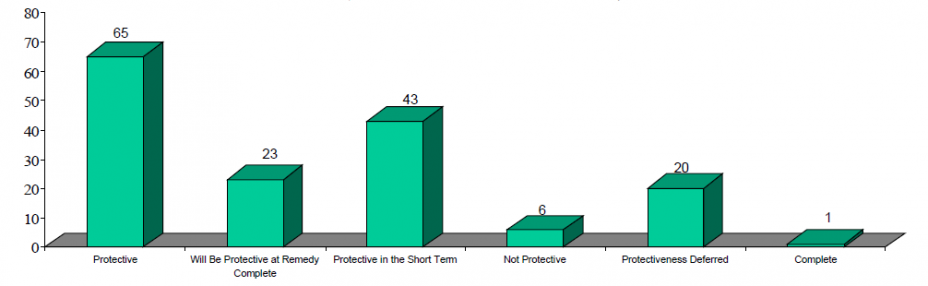
- Status of 5 Year Review Protectiveness Statements
- Environmental Indicators at Federal Facilities
- Site Wide Ready for Anticipated Use
- Notes
NPL Federal Facilities By Agency
(Final and Deleted)
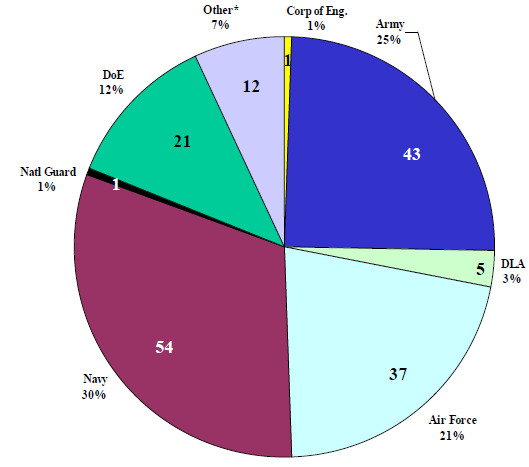
*Other Federal Agencies include: Coast Guard (1), DOI (2), DOT (1), EPA (1), FAA (1), NASA (2), SBA (1), USDA (2), VET ADMIN (1).
Status of NPL Federal Facilities
| NPL Status | Number of Federal Facilities | Number of Private Sites | Federal Facility % of NPL Universe |
|---|---|---|---|
| Final | 157 | 1,156 | 12% |
| Deleted | 17 | 355 | 4.6% |
| Total* | 174 | 1,511 | 10.3% |
*Total number of Federal Facilities and private sites on the NPL is 1,676
Regional Percentage Distribution of Fiscal Year 2013 Accomplishments
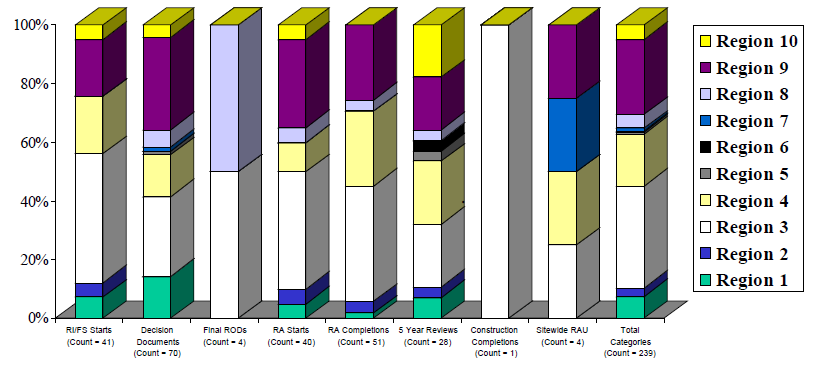
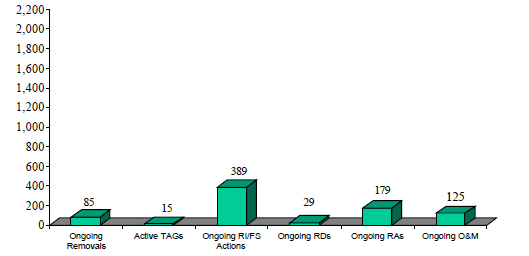
Current Site Work
Completed Site Work
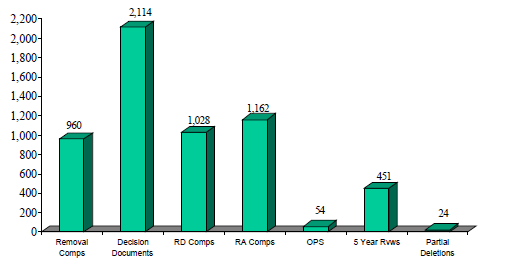
NPL Federal Facility Site Cleanup Pipeline
Interagency Agreements
% of NPL Federal Facilities with Completed IAGs
Federal Agencies that have not achieved 100% of their IAGs/FFAs:
| Agency | # w/ IAG | Total # | Percent |
|---|---|---|---|
| Army | 42 | 43 | 97.7% |
| Air Force | 36 | 37 | 97.3% |
| NASA | 1 | 2 | 50.0% |
| Veterans Admin | 0 | 1 | 0.0% |
| Dept. of Agriculture | 1 | 2 | 50.0% |
| Dept. of Transportation | 0 | 1 | 0.0% |
| SBA* | 0 | 1 | 0.0% |
| Agency | # w/ IAG | Total # | Percent |
|---|---|---|---|
| Navy | 54 | 54 | 100.0% |
| Dept. of Energy | 21 | 21 | 100.0% |
| DLA | 5 | 5 | 100.0% |
| Dept. of Interior | 2 | 2 | 100.0% |
| Coast Guard | 1 | 1 | 100.0% |
| National Guard | 1 | 1 | 100.0% |
| USACE | 1 | 1 | 100.0% |
| EPA | 1 | 1 | 100.0% |
| FAA | 1 | 1 | 100.0% |
Institutional Controls at NPL Facilities
Remedial Actions and Removal Actions with Institutional Controls
Note: There are 158 NPL Federal Facilities with Institutional Controls.
Status of 5 Year Review Protectiveness Statements
Status of Remedies Requiring Monitoring at NPL Facilities
Total Number of Sites with Completed 5 Year Reviews = 158
(Latest Protectiveness Statement at Site)
Note: In the second quarter of FY 2005, EPA implemented a change in the way 5 Year Review data is recorded.
Environmental Indicators at Federal Facilities
EI Status for Final NPL Federal Facilities
(Total Facilities = 174)
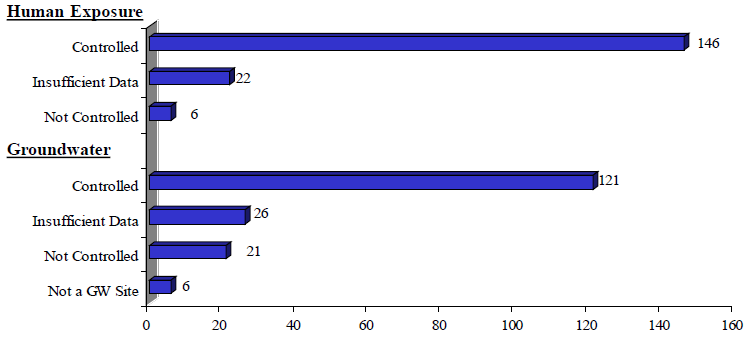
Note: 65% of Facilities have both Human Exposure and Groundwater controlled; 1% of Facilities have neither Human Exposure nor Groundwater controlled.
Site Wide Ready for Anticipated Use
Notes
- All data from 11/12/2013 CERCLIS 3.
- NPL cleanup data includes both Superfund and RCRA activity at Superfund Federal Facilities.