Climate Change Indicators: Drought
This indicator measures drought conditions of U.S. lands.
-

This chart shows annual values of the Palmer Drought Severity Index, averaged over the entire area of the contiguous 48 states. Positive values represent wetter-than-average conditions, while negative values represent drier-than-average conditions. A value between -2 and -3 indicates moderate drought, -3 to -4 is severe drought, and -4 or below indicates extreme drought. The thicker line is a nine-year weighted average.
Data source: NOAA, 20165
Web update: August 2016 -

This chart shows the percentage of U.S. lands classified under drought conditions from 2000 through 2015. This figure uses the U.S. Drought Monitor classification system, which is described in the table below. The data cover all 50 states plus Puerto Rico.
Data source: National Drought Mitigation Center, 20166
Web update: August 2016Categories of Drought Severity Category Description Possible Impacts D0 Abnormally dry Going into drought: short-term dryness slowing planting or growth of crops or pastures. Coming out of drought: some lingering water deficits; pastures or crops not fully recovered. D1 Moderate drought Some damage to crops or pastures; streams, reservoirs, or wells low; some water shortages developing or imminent; voluntary water use restrictions requested. D2 Severe drought Crop or pasture losses likely; water shortages common; water restrictions imposed. D3 Extreme drought Major crop/pasture losses; widespread water shortages or restrictions. D4 Exceptional drought Exceptional and widespread crop/pasture losses; shortages of water in reservoirs, streams, and wells, creating water emergencies.


Key Points
- Average drought conditions across the nation have varied since records began in 1895. The 1930s and 1950s saw the most widespread droughts, while the last 50 years have generally been wetter than average (see Figure 1).
- Over the period from 2000 through 2015, roughly 20 to 70 percent of the U.S. land area experienced conditions that were at least abnormally dry at any given time (see Figure 2). The years 2002–2003 and 2012–2013 had a relatively large area with at least abnormally dry conditions, while 2001, 2005, and 2009–2011 had substantially less area experiencing drought.
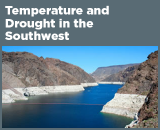
- During the latter half of 2012, more than half of the U.S. land area was covered by moderate or greater drought (see Figure 2). In several states, 2012 was among the driest years on record.4 See Temperature and Drought in the Southwest for a closer look at recent drought conditions in one of the hardest-hit regions.
Background
There are many definitions and types of drought. Meteorologists generally define drought as a prolonged period of dry weather caused by a lack of precipitation that results in a serious water shortage for some activity, population, or ecological system. Drought can also be thought of as an extended imbalance between precipitation and evaporation.
As average temperatures have risen because of climate change, the Earth’s water cycle has sped up through an increase in the rate of evaporation. An increase in evaporation makes more water available in the air for precipitation, but contributes to drying over some land areas, leaving less moisture in the soil. Thus, as the climate continues to change, many areas are likely to experience increased precipitation (see the U.S. and Global Precipitation indicator) and increased risk of flooding (see the Heavy Precipitation indicator), while areas located far from storm tracks are likely to experience less precipitation and increased risk of drought. As a result, since the 1950s, some regions of the world have experienced longer and more intense droughts, particularly in southern Europe and West Africa, while other regions have seen droughts become less frequent, less intense, or shorter (for example, in central North America).1
Drought conditions can negatively affect agriculture, water supplies, energy production, and many other aspects of society. The impacts vary depending on the type, location, intensity, and duration of the drought. For example, effects on agriculture can range from slowed plant growth to severe crop losses, while water supply impacts can range from lowered reservoir levels and dried-up streams to major water shortages. Prolonged droughts pose a particular threat to indigenous populations because of their economic and cultural dependence on land and water supplies. Warming and drought can threaten medicinal and culturally important plants and animals and can reduce water quality and availability, making tribal populations particularly vulnerable to waterborne illnesses.2 Lower streamflow and groundwater levels can also harm plants and animals, and dried-out vegetation increases the risk of wildfires.
About the Indicator
During the 20th century, many indices were created to measure drought severity by looking at precipitation, soil moisture, stream flow, vegetation health, and other variables.3 Figure 1 shows annual values of the most widely used index, the Palmer Drought Severity Index, which is calculated from precipitation and temperature measurements at weather stations. An index value of zero represents the average moisture conditions observed between 1931 and 1990 at a given location. A positive value means conditions are wetter than average, while a negative value is drier than average. Index values from locations across the contiguous 48 states have been averaged together to produce the national values shown in Figure 1.
For a more detailed perspective on recent trends, Figure 2 shows a newer index called the Drought Monitor, which is based on several indices (including Palmer), along with additional factors such as snow water content, groundwater levels, reservoir storage, pasture/range conditions, and other impacts. The Drought Monitor uses codes from D0 to D4 (see table below Figure 2) to classify drought severity. This part of the indicator covers all 50 states and Puerto Rico.
Indicator Notes
Because this indicator focuses on national trends, it does not show how drought conditions vary by region. For example, even if half of the country suffered from severe drought, Figure 1 could show an average index value close to zero if the rest of the country was wetter than average. Thus, Figure 1 might understate the degree to which droughts are becoming more severe in some areas while other places receive more rain as a result of climate change.
The U.S. Drought Monitor (Figure 2) offers a closer look at the percentage of the country that is affected by drought. This index is relatively new, however, and thus too short-lived to be used for assessing long-term climate trends or exploring how recent observations compare with historical patterns. With several decades of data collection, future versions of this indicator should be able to paint a more complete picture of trends over time.
Overall, this indicator gives a broad overview of drought conditions in the United States. It is not intended to replace local or state information that might describe conditions more precisely for a particular region.
Data Sources
Data for Figure 1 were obtained from the National Oceanic and Atmospheric Administration’s National Centers for Environmental Information, which maintains a large collection of climate data online at: www7.ncdc.noaa.gov/CDO/CDODivisionalSelect.jsp. Data for Figure 2 were provided by the National Drought Mitigation Center. Historical data in table form are available at: http://droughtmonitor.unl.edu/MapsAndData.aspx.
Technical Documentation
References
1 IPCC (Intergovernmental Panel on Climate Change). 2013. Climate change 2013: The physical science basis. Working Group I contribution to the IPCC Fifth Assessment Report. Cambridge, United Kingdom: Cambridge University Press. http://www.ipcc.ch/report/ar5/wg1.
2 Gamble, J.L., J. Balbus, M. Berger, K. Bouye, V. Campbell, K. Chief, K. Conlon, A. Crimmins, B. Flanagan, C. Gonzalez-Maddux, E. Hallisey, S. Hutchins, L. Jantarasami, S. Khoury, M. Kiefer, J. Kolling, K. Lynn, A. Manangan, M. McDonald, R. Morello-Frosch, M.H. Redsteer, P. Sheffield, K. Thigpen Tart, J. Watson, K.P. Whyte, and A.F. Wolkin. 2016. Chapter 9: Populations of concern. The impacts of climate change on human health in the United States: A scientific assessment. U.S. Global Change Research Program. https://health2016.globalchange.gov.
3 Heim, R.R. 2002. A review of twentieth-century drought indices used in the United States. B. Am. Meteorol. Soc. 83(8):1149–1165.
4 NOAA (National Oceanic and Atmospheric Administration). 2013. State of the climate: Drought: December 2012. Accessed July 2013. www.ncdc.noaa.gov/sotc/drought/2012/12.
5 NOAA (National Oceanic and Atmospheric Administration). 2016. National Centers for Environmental Information. Accessed January 2016. www7.ncdc.noaa.gov/CDO/CDODivisionalSelect.jsp.
6 National Drought Mitigation Center. 2016. Maps and data. Accessed January 2016. http://droughtmonitor.unl.edu/MapsAndData.aspx.
Learn about other indicators in this section