New York City Assesses Extreme Heat Climate Risk
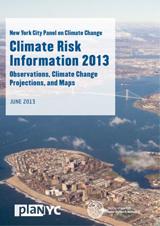
 New York City’s Climate Risk Information Vulnerability Assessment (PDF) (38 pp, 1.2 MB, About PDF) ExitHeat waves are one of the leading weather-related causes of death in the Unites States. Recognizing the current and future extreme heat risk to its population, NYC decided to assess climate risk and vulnerability. To assess the risk of future extreme heat events, the New York City Panel on Climate Change (NPCC) used the most up-to-date global climate models at the time. The NPCC's Climate Risk Information Report identified a baseline (covering the period 1970-2000) of two heat waves per year on average. NYC projected the number of heat waves could increase (using the 90th percentile as the high estimate) to seven per year by 2050. Additionally, the NPCC's 2013 report states the average annual number of days over 90°F could more than triple (under the high estimate) from 18 to 57 by 2050.
NYC updated its emergency response and hazard mitigation plans as a result of its Climate Risk Information Report. New York City is continuing to refine their climate projections to better assess climate vulnerability under the best-available science. The most recent update was in the 2015 "NPCC: Building the Knowledge Base for Climate Resiliency Report," which for the first time included projections to the year 2100.
| How Did They Do It? | Applicable EPA Tools |
|---|---|
Assessed climate risk
|
Learn more about the type of models available to assess climate risk at the US Global Change Research Programs website. |
Incorporated climate risk within adaptation and response plans
|
EPA’s Excessive Heat Events Guidebook helps communities identify current and future disaster response needs for adapting and proving resilient to extreme heat climate risk. |
Educate residents on the threats from extreme heat and provides preparedness resources
|
The Green Infrastructure Wizard Tool can help communities implement an appropriate demonstration project that increases education and awareness about the climate risk from extreme heat. |
Re-assessing vulnerability under the best available science
|
CDC’s Assessing Health Vulnerability to Climate Change helps communities identify populations most at risk from extreme heat events and other climate threats. Assessing Health Vulnerability to Climate Change (PDF) (24 pp, 4.3 MB) * (This is a non-EPA resource from the Centers for Disease Control and Prevention.) |
Similar Cases and More Information
Extreme heat events and other weather extremes can disproportionately impact at-risk or vulnerable communities. To view a case study that identified and then actively engaged with vulnerable communities in adaptation planning for heat events, view the Chicago Heat Emergency Response. To see how a community has used green infrastructure to both reduce the impact of future extreme heat events and reduce stormwater runoff during extreme precipitation events, view Chicago Green Infrastructure to Reduce Heat.
References
The following links exit the site Exit
- Building the Knowledge Base for Climate Resiliency: New York City Panel on Climate Change 2015 Report
- 2014 New York City Hazard Mitigation Plan (PDF) (550 pp, 67 MB)
- Summer Heat It’s Enough to Make You Sick (PDF)(4 pp, 326 K)
- NYC Health: Extreme Heat and Your Health
- Ready New York Guides and Resource
- Climate Risk Information 2013 (PDF)(38 pp, 1.2 MB)
