Clean Air Markets - Emissions Tracking Highlights
- Annual and Long Term Data
- Quarterly Data: 2015 vs. 2016 (Quarters 1 to 3)
- Coal-fired Characteristics and Controls: 2015
- Changes in Control Technologies at Coal-Fired Units: 2000-2016
- Video tutorials of interactive motion charts
EPA regularly posts updates of quarterly sulfur dioxide (SO2) and nitrogen oxides (NOx) emissions data from coal-fired power plants subject to the Acid Rain Program (ARP), the Clean Air Interstate Rule (CAIR), and/or the Cross-State Air Pollution Rule (CSAPR) to make it easy for the public to track changes in emissions from these sources. Final 2015 and preliminary 2016 data show emissions since CSAPR replaced CAIR. All of the data presented here are also available in Air Market Program Data (AMPD). Preliminary data show that while a few facilities are emitting more SO2 and/or NOx, or are emitting SO2 and/or NOx at a greater rate, overall emissions are decreasing.
Annual Data and Long Term Data
The data presented here compare emissions, emission rates, and heat input from coal-fired power plant units in the ARP, CAIR and CSAPR. These files graphically and spatially compare annual emission data from 2014 with 2015 as well as presenting long-term data at the facility level. The data presented here are final data for 2014 and preliminary data for 2015.
- Table of Emissions, Emission Rates, Heat Input: 2014 vs. 2015 (1 pg, 270 K)
- Table of Long-term Emission Changes: 2009 vs 2015
Interactive Motion Charts:
- Annual ARP Coal-Fired SO2 Emissions, SO2 Emission Rates and Heat Input Over Time, 1990 to 2015
- Annual ARP Coal-Fired NOx Emissions, NOx Emission Rates and Heat Input Over Time, 1995 to 2015
- Annual ARP Coal-Fired CO2 Emissions, CO2 Emission Rates and Heat Input Over Time, 1995 to 2015
Quarterly Data: 2015 vs. 2016 (Quarters 1 to 3)
The data presented here compare emissions, emission rates, and heat input from coal-fired power plant units in the ARP and CSAPR. These files graphically and spatially compare quarterly emission data from 2015 with data for the same quarter from 2016. The data presented here are final data for 2015 and preliminary data for 2016 that are currently under review. As data are reviewed and verified, these materials will be updated.
Table of Emissions, Emission Rates, Heat Input: 2015 vs. 2016(1 pg, 666 K)
Coal-fired Characteristics and Controls: 2015
The data presented here provide emissions, heat input, capacity, on-line year, emission controls, program applicability, addresses, and additional identifying information for coal-fired power plant units, regardless of their inclusion in the Acid Rain Program. These files contain data current as of 2015.
The data show the percent of coal-fired units, generating capacity, and generation with advanced emission controls.
Changes in Control Technologies at Coal-Fired Units: 2000-2016
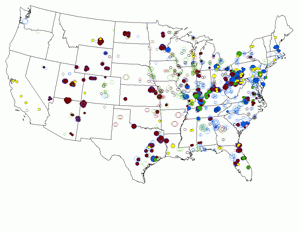
 The following figures display where particular control technologies have been installed between 2000 to 2015 as well as what technologies EPA anticipates will be installed in 2016 based on the information obtained from major company contacts and industry sources.
The data show that more and more coal-fired units are installing advanced controls, such as scrubbers, which are dramatically reducing pollution across the country.
