Sulfur Dioxide Trends
National Trends in Sulfur Dioxide Levels
Using a nationwide network of monitoring sites, EPA has developed ambient air quality trends for sulfur dioxide (SO2). Trends starting in 1980, 1990, and 2000 are shown here. Under the Clean Air Act, EPA sets and reviews national air quality standards for SO2. Air quality monitors measure concentrations of SO2 throughout the country. EPA, state, tribal and local agencies use that data to ensure that SO2 in the air is at levels that protect public health and the environment. Nationally, average SO2 concentrations have decreased substantially over the years. For information on SO2 standards, sources, health effects, and programs to reduce SO2, please see www.epa.gov/so2-pollution.
How to Interpret the Graphs
Regional Trends in Sulfur Dioxide Levels
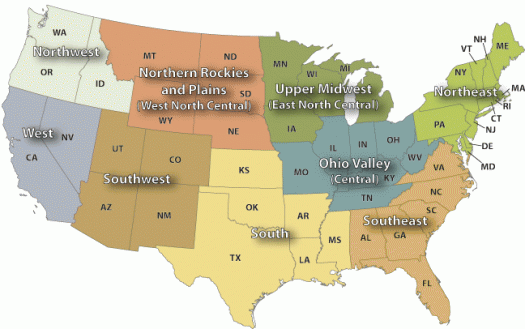
Air quality trends can vary regionally. The following climatically consistent regions within the contiguous United States provide a relevant way to look at regional trends in air quality.
 Source: NOAA National Climatic Data CenterSelect a region: (graph appears below)
Note: The Northwest region does not have enough data to construct a regional trend for sulfur dioxide.
